Session: MP64: Kidney Cancer: Epidemiology & Evaluation/Staging/Surveillance III
MP64-18: Reclassification of pathologically upstaged T3a Renal Cell Carcinoma is linked with enhanced alignment of outcomes: Analysis of the National Cancer Database
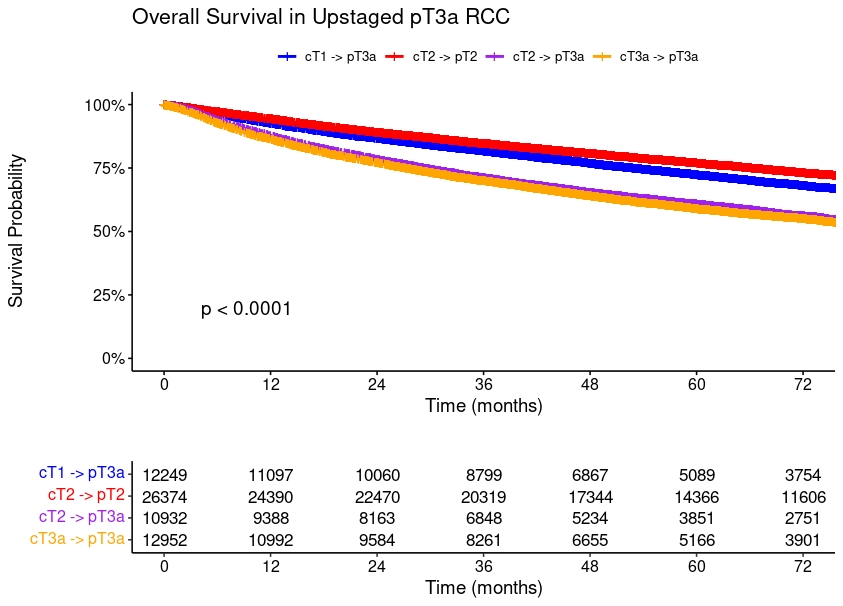
Introduction: Pathological upstaging to pT3a disease can occur after surgical treatment of clinical T1 and T2 Renal Cell Carcinoma (RCC), and upstaging to T3 RCC is associated with poorer outcomes. Nonetheless pT3a RCC is a heterogeneous group with a wide variance in outcomes. With an intent to delve deeper into the disparateness in outcomes of pT3a disease, we investigated the outcomes of patients with an initial clinical stage of cT1, cT2 and cT3a. Methods: Using the National Cancer Database, patients with RCC were categorized by pathological and clinical staging of RCC according to American Joint Committee on Cancer (AJCC) criteria. The primary outcome was measured as overall survival (OS). Kaplan-Meier Analysis (KMA) assessed differences between cT1 upstaged to pT3a RCC (cTa?pT3a), cT2 upstaged to pT3a RCC (cT2?pT3a), clinical/pathological T2 RCC (cT2?pT2), and clinical/pathological T3a RCC (T3a?pT3a). Multivariable cox regression (MVA) assessed predictors for OS evaluating clinical and pathological disease status. ROC/AUC analysis was utilized to compare predictive value of AJCC 8th edition TNM staging vs proposed staging. Results: 53741 patients with pT3a disease were analyzed (10785 cT1 ? pT3a; 9675 cT2 ? pT3a, 22025 cT2 ? pT2; and 11256 cT3a ? pT3a). MVA for OS [cT1 ? pT3a (referent)] demonstrated that cT2 ? pT3a (HR=1.33, p<0.001) and cT3a ? pT3a (HR=1.35, p<0.001) were associated with worsened OS, while cT2 ? pT2 (HR=0.96, p=0.05) was not significantly different from referent. KMA revealed a difference in 5-year OS (cT1?pT3a 73.1%; cT2?pT2 78.0%; cT2?pT3a 60.8%; and cT3a?pT3a 59.9%, p < 0.001). As such we proposed to align cT1?pT3a and cT2?pT2 into a new pT2 group while maintaining cT2?pT3a and cT3a?pT3a in a new pT3a (5 year OS new pT2 vs. new pT3a: 78.0% vs. 60.3%, p=0.003). ROC analysis revealed an AUC of 0.500 (p=0.005) for OS using the current AJCC 8th edition TNM staging and an AUC of 0.563 (p=0.003) for OS for our new proposal. Conclusions: Reclassification of cT1 ? pT3a and cT2? pT2 into a new pT2 RCC while maintaining cT2? pT3a and cT3a ? pT3a RCC as a new pT3a RCC resulted in improved performance of realigned model for OS. Revision of TNM criteria for T2 and T3a RCC may lead to improved predictive ability and less heterogeneity in outcomes. SOURCE OF Funding: Insitutional

 photo")