Category: Antimicrobial Stewardship: Diagnostics/Diagnostic Stewardship
Poster Session: Antimicrobial Stewardship: Diagnostics/Diagnostic Stewardship


Timothy Savage
Pediatric Infectious Diseases Fellow
Boston Chidren's Hospital
Brookline, Massachusetts
Disclosure: I do not have any relevant financial / non-financial relationships with any proprietary interests.
Shun Rao
Biostatistics Student Intern
Boston Children's Hospital
Boston, Massachusetts
Disclosure: I do not have any relevant financial / non-financial relationships with any proprietary interests.
Jill Joerger
Senior Laboratory Quality Analyst
Boston Children's Hospital
Malden, Massachusetts
Disclosure: I do not have any relevant financial / non-financial relationships with any proprietary interests.
Al Ozonoff
Associate Director
Boston Children's Hospital
Boston, Massachusetts
Disclosure: I do not have any relevant financial / non-financial relationships with any proprietary interests.
Alexander McAdam
Vice-Chair of Laboratory Medicine/Associate Professor of Pathology
Boston Children's Hospital/Harvard Medical SChool
Boston, Massachusetts
Disclosure: I do not have any relevant financial / non-financial relationships with any proprietary interests.

Thomas J. Sandora
Hospital Epidemiologist
Boston Children's Hospital
Boston, Massachusetts
Disclosure: I do not have any relevant financial / non-financial relationships with any proprietary interests.
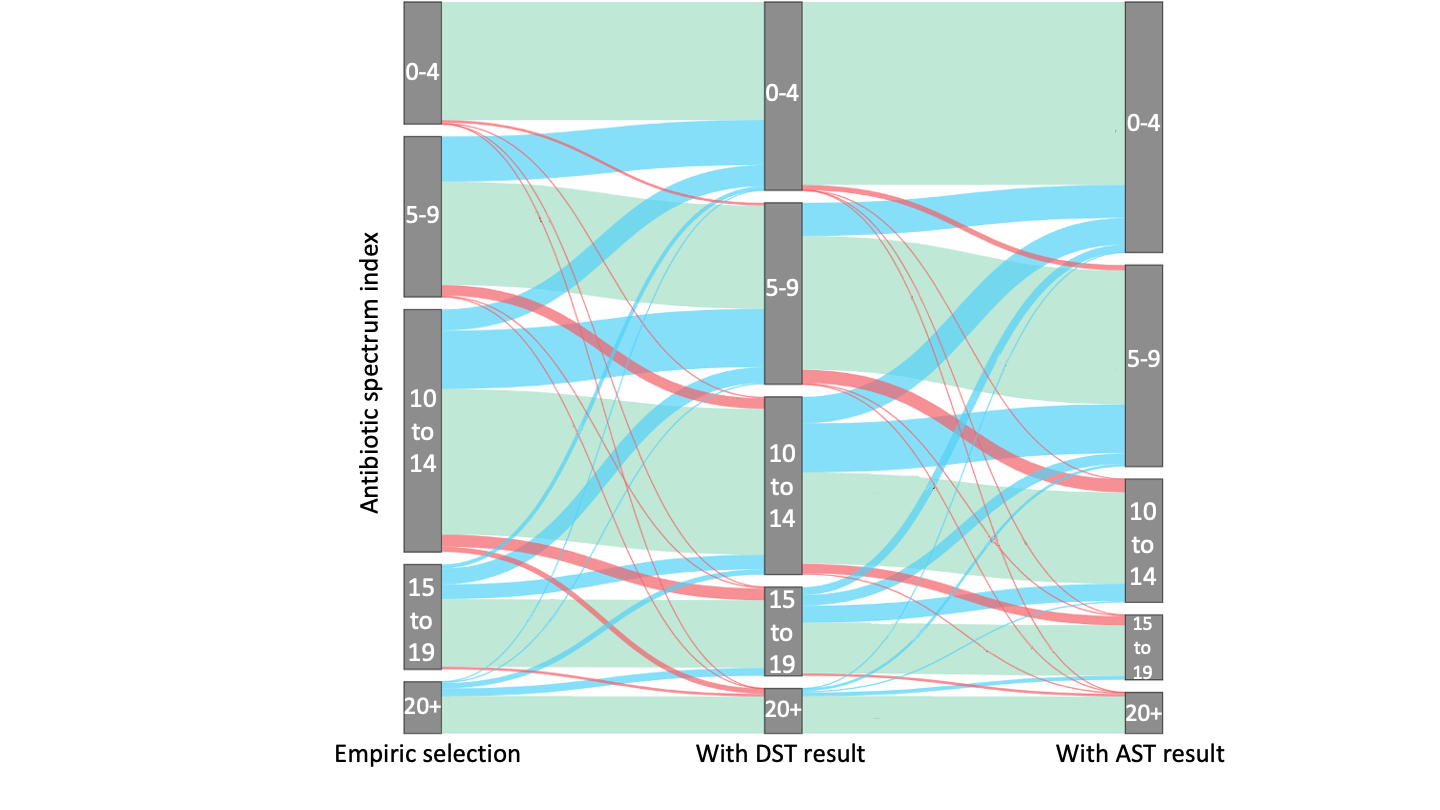
 Figure: Distribution of spectrum of antibiotics ordered to treat bacteremia in pediatric patients. Antibiotic spectrum, as measured by the antibiotic spectrum index, is represented in this Sankey diagram on the Y-axis. The height of each group indicates the proportion of patients with an aggregate antibiotic spectrum falling in that category at three time points. The ASI of empiric antibiotics was measured just before the DST result to provide time for a treating physician to settle on an empiric regimen. The ASI with the DST result was measured just before the ASI result. The ASI with the AST result was measured 24 hours after the AST result was available. Green bars indicate the proportion of patients within a group whose ASI remained unchanged between time points. Blue bars indicate the proportion of patients within a group whose ASI decreased, and red bars indicate the proportion of patients whose ASI increased between time points.