Category: HAI: Outbreaks
Poster Session: HAI: Outbreaks

Gayathri Krishnan
Infectious Diseases Fellow
Washington University School of Medicine
St. Louis, Missouri
Disclosure: I do not have any relevant financial / non-financial relationships with any proprietary interests.
Zulema Udaondo
Post doctoral fellow
UAMS
Little Rock, Arkansas
Disclosure: I do not have any relevant financial / non-financial relationships with any proprietary interests.
Se-Ran Jun
Assistant Professor
University of Arkansas for Medical Sciences
Little Rock, Arkansas
Disclosure: I do not have any relevant financial / non-financial relationships with any proprietary interests.
Atul Kothari
Assistant Professor of Medicine
University of Arkansas for Medical Sciences
Little Rock, Arkansas
Disclosure: Ansun Biopharma (Consultant)
 Image 2 - Tree of Life
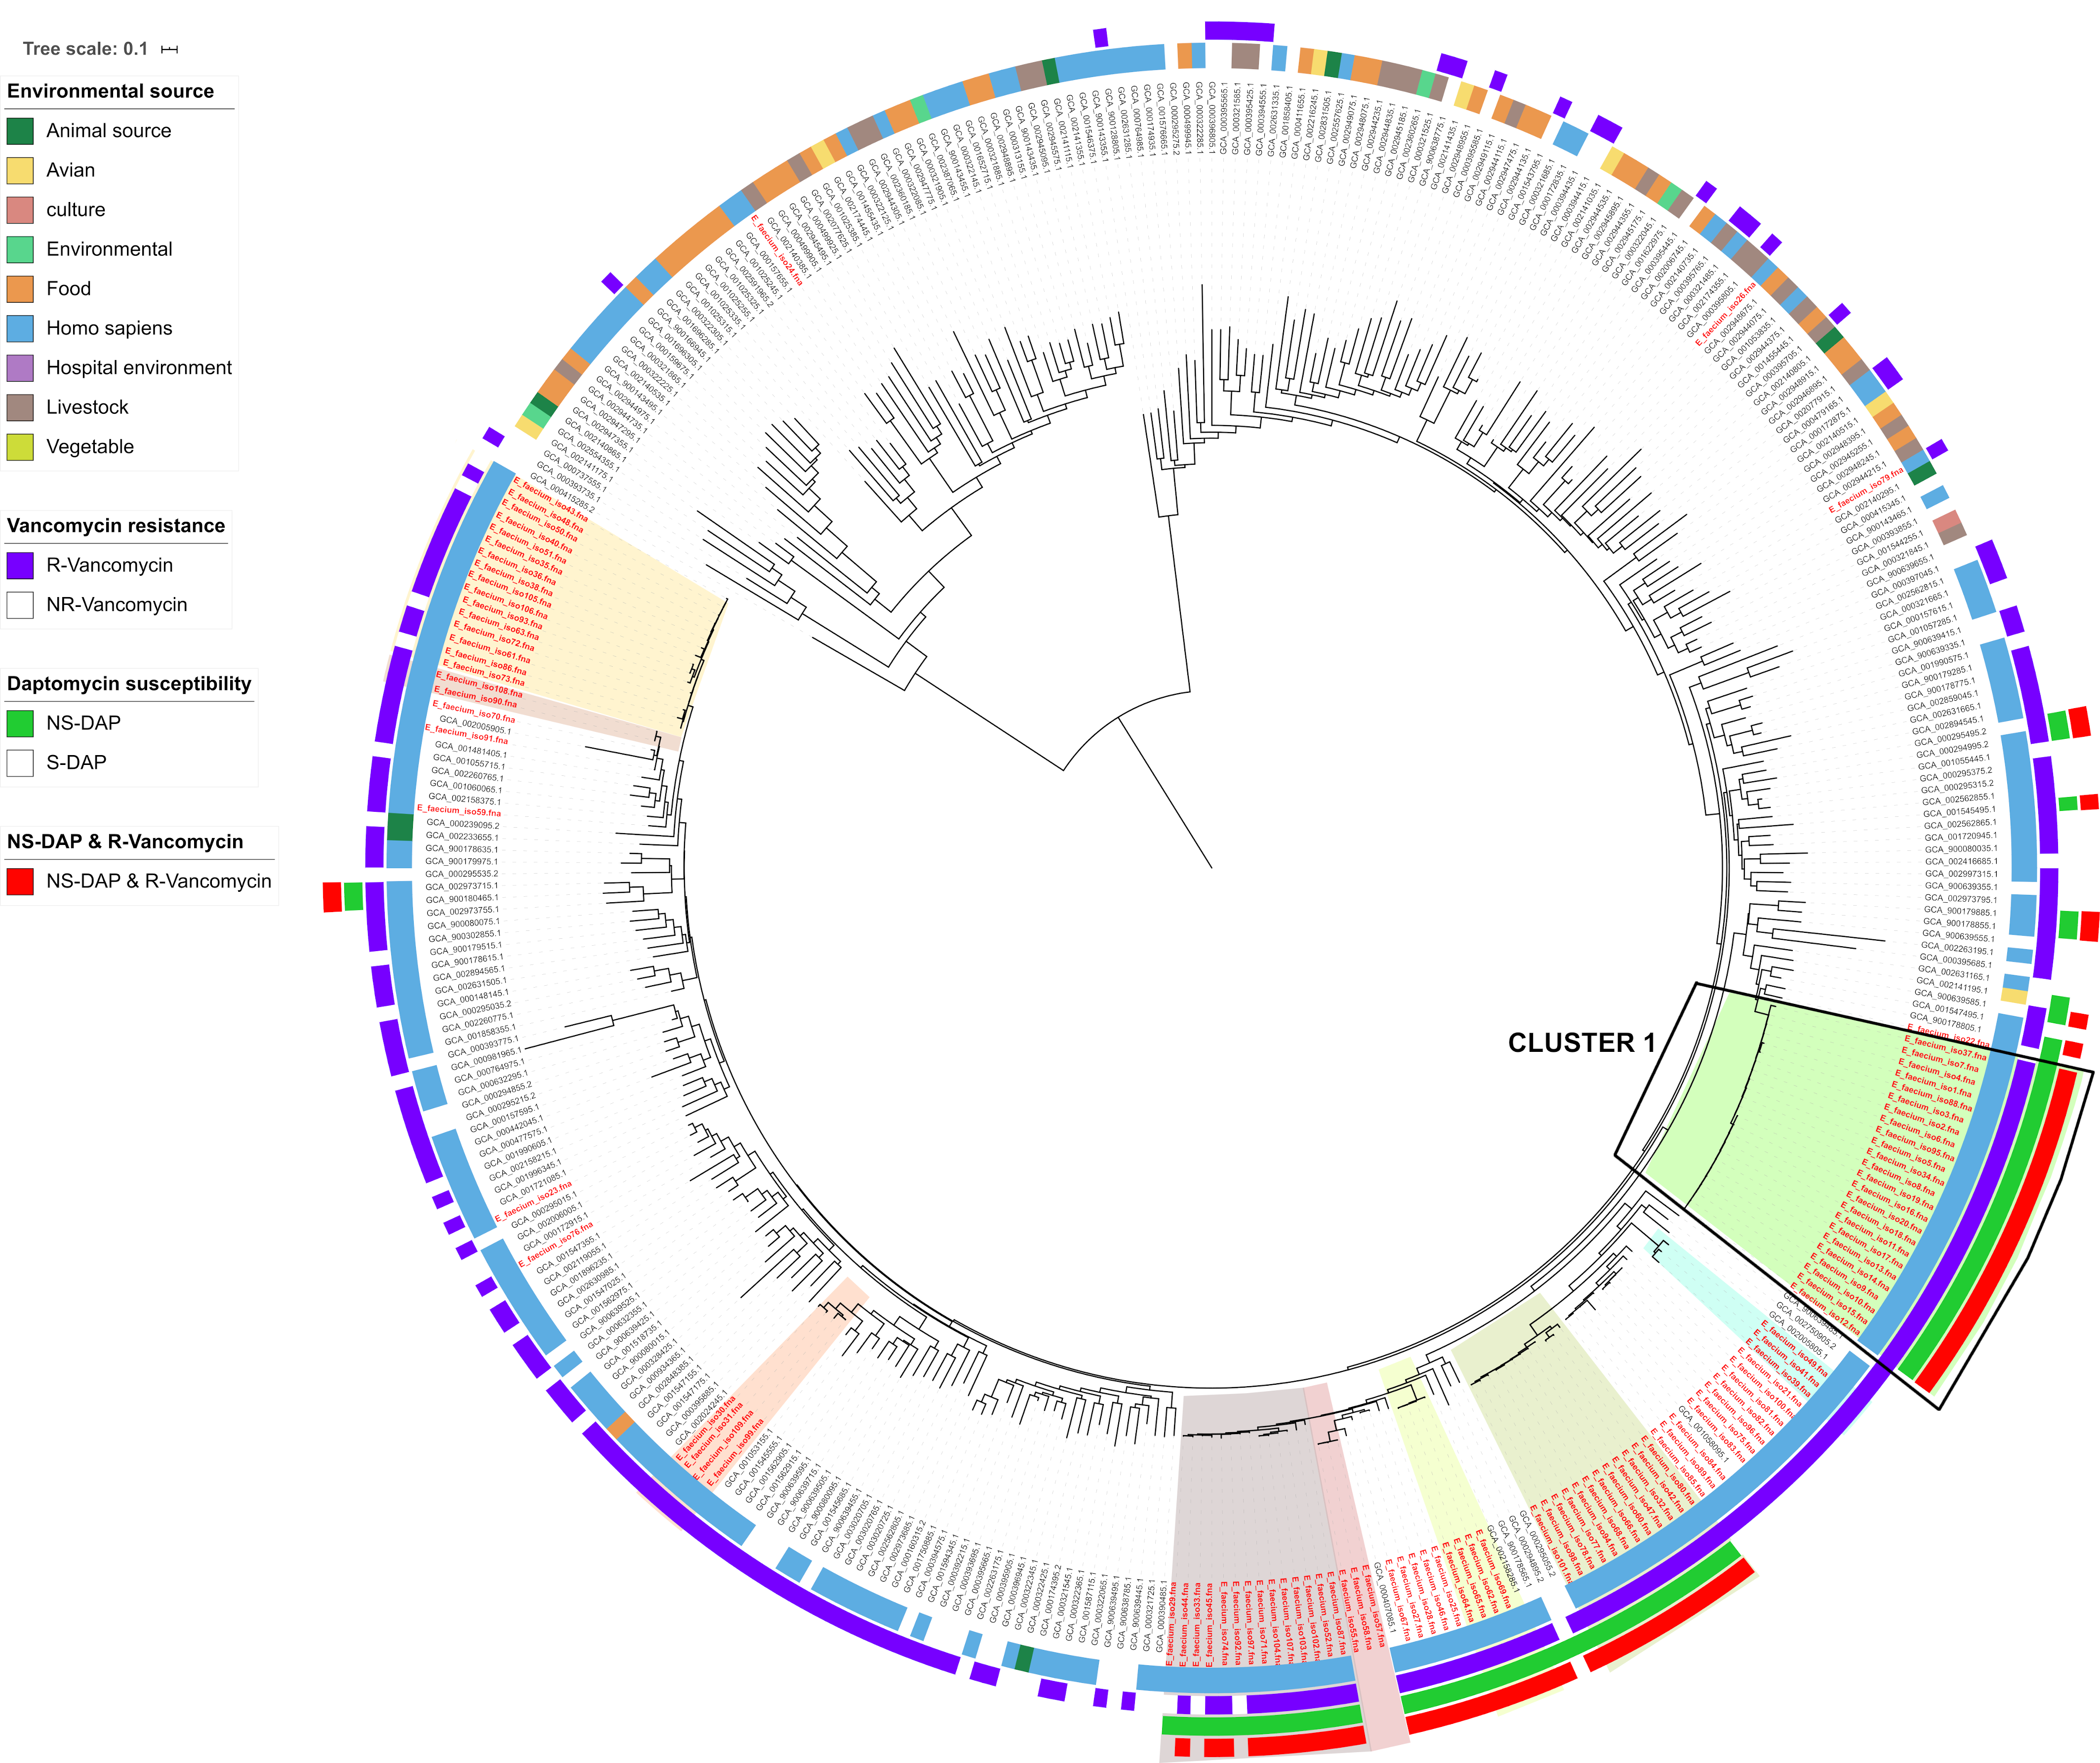
.png) Image 4 - Dendrogram of 106 isolates performed with coreSNP(Single Nucleotide Polymorphisms) pairwise distances. • Dendogram shows different patients (same color for isolates that belong to the same patient) and the patient numbers. • Besides the patient number, the number of largest number SNPS that separate those isolates is shown. • Branches represent the number of coreSNPs that differ strains from that branch. As you see isolates from cluster 1 differ in a maximum of 5 SNPs but isolates of patient 1 and patient 2 differ in 0 SNPs between them. Cluster 1 is represented by a green square.
Image 4 - Dendrogram of 106 isolates performed with coreSNP(Single Nucleotide Polymorphisms) pairwise distances. • Dendogram shows different patients (same color for isolates that belong to the same patient) and the patient numbers. • Besides the patient number, the number of largest number SNPS that separate those isolates is shown. • Branches represent the number of coreSNPs that differ strains from that branch. As you see isolates from cluster 1 differ in a maximum of 5 SNPs but isolates of patient 1 and patient 2 differ in 0 SNPs between them. Cluster 1 is represented by a green square..jpg) Image 5 - Time period of infections
Image 5 - Time period of infections