University of Connecticut North Grafton, Massachusetts, United States
Purpose: Current research has shown that short, non-coding miRNAs play a major role in the onset and progression of many diseases. miRNAs bind to target RNA molecules at the 3’ untranslated region to induce translational repression and prevent the production of harmful disease-causing proteins. In diseases such as cancer, harmful miRNAs known as oncomiRs are heavily upregulated. However, there are good miRNAs that are downregulated and are known as tumor suppressor miRNAs. To combat miRNA dysregulation, miRNA-based therapeutics can be in the form of either antimiRs, which block the activity of different upregulated miRNAs and miRNA mimics, which act by increasing levels of different downregulated miRNA. In many solid tumors and hematological malignancies, miR-34a is a tumor suppressor miRNA found to be depleted. miR-34a is known to inhibit many cancer casing pathways such as the epithelial to mesenchymal transition and acts in a positive feedback loop with the tumor suppressor transcription factor, p53. Here, we utilized a cationic delivery system, PLGA:poly-L-Histidine nanoparticles, to effectively deliver miR-34a mimics to target lung cancer (Malik and Wahane et al., 2021). By using a cationic delivery system, we are able to encapsulate negatively charged miRNA mimics with minimal toxicity and reduce the survival of lung adenocarcinoma cell lines while prolonging in vivo survival. Methods: We encapsulated a commercially purchased miR-34a mimic into PLGA:poly-L-Histidine nanoparticles using a double emulsion solvent evaporation method that was previously optimized (Wahane, Malik et al., 2021). We utilized biophysical characterization techniques to perform through characterization of our formulation, including dynamic light scattering, SEM/TEM imaging, loading/release kinetics as well as RNA integrity analysis to confirm successful loading and stability of the mimic in our formulation. We tested our formulation in vitro in the A549 lung adenocarcinoma epithelial cell line where we evaluated cellular uptake by using confocal microscopy and flow cytometry. We then evaluated in vitro efficacy by measuring levels of miR-34a and its target, p53 with RT-PCR and Western blot analysis. The increase in p53 was also tested in hypoxic conditions to mimic the tumor microenvironment. Cell viability was also tested through colonogenic assay and the extent to which cells became apoptotic after treating with our formulation was tested using an Annexin-V based apoptosis assay in both fluorescence microcopy and flow cytometry. A549 xenograft mice were treated intratumorally and RT-PCR was used to quantify miR-34a and p53 levels. Western blot was used for protein quantification of p53. For in vivo studies, A549 xenograft mice were treated with miR-34a NPs intratumorally and tumors were measured daily. Overall survival was plotted. Results: We obtained miR-34a mimic loaded PLGA:PH nanoparticles of 200nm in particle with a uniform size distribution (PDI < 0.2). The change in surface charge comparing positively charged PLGA:PH nanoparticles (+2mV) with negatively charged miR-34a loaded nanoparticles (-22mV) confirmed successful loading of miR-34a mimics in our formulation. SEM and TEM imaging revealed spherical morphology of both nanoparticles with and without mimics as well as stability in the solution state. Total loading of mimic in nanoparticles was 150picomoles/mg where nanoparticles exhibited an initial burst release at 15 minutes, followed by 100% release by 24-48hrs. Polyacrylamide gel electrophoresis confirmed stability of miR-34a mimic in our formulation after 48hrs. When treating the A549 cell line with our formulation, we observed better cellular uptake of miR-34a when delivering through our nanoformulation when compared with transfecting Lipofectamine at an equivalent dose, confirmed by fluorescence microcopy and flow cytometry. Gene expression analysis showed that treating with miR-34a loaded nanoparticles increased miR-34a levels by 5-fold when compared to Scr-34a loaded nanoparticles. This effectively increased p53 levels by 50%, resulting in a 2.5 fold increase in p53 on the protein level. In hypoxic conditions, our formulation increased the levels of p53 by 25%. We were able to reduce the colony forming efficiency by 60% and observed fewer A549 colonies when treating with miR-34a loaded nanoparticles. Annexin-V based assays revealed higher population of cells in the apoptotic/necrotic state when treating with our formulation. The in vivo survival of A549 xenograft mice was increased by 2 days when treated with miR-34a NPs intratumorally. Conclusion: We were successfully able to load a tumor suppressor miR-34a mimic in a cationic delivery system comprising of PLGA:poly-L-Histidine nanoparticles, and deliver with high cellular uptake. We achieved in vitro efficacy by effectively increasing levels of miR-34a and p53, while reducing the overall cell viability of the A549 cell line. We were also able to increase the survival of mice treated by miR-34a NPs intratumorally with the desired target response of p53 and SIRT1 on the gene and protein level to establish the therapeutic potential to treat lung cancer. References: 1. Wahane, A., Malik, S., Shih, K.-C., Gaddam, R. R., Chen, C., Liu, Y., Nieh, M.-P., Vikram, A., & Bahal, R. (2021). Dual-Modality Poly- L -histidine Nanoparticles to Deliver Peptide Nucleic Acids and Paclitaxel for In Vivo Cancer Therapy. ACS Applied Materials & Interfaces, 13(38), 45244–45258. https://doi.org/10.1021/acsami.1c11981
Acknowledgements: Disclaimer: The authors declare no conflict of interest. We thank the following funding agencies: R.E. Singiser Fellowship, NIH, UConn Startup Bahal Lab members
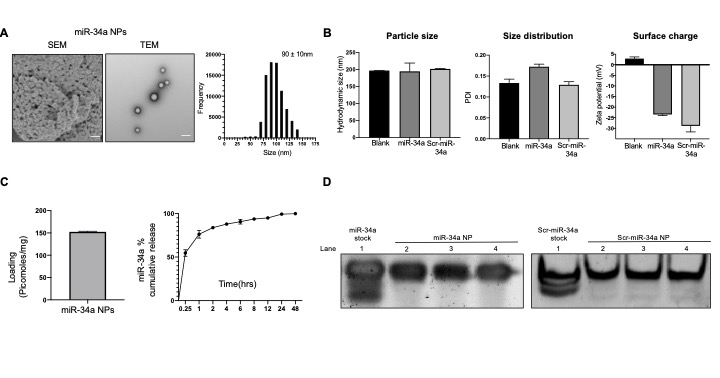
Figure 1: Biophysical characterization of miR-34a NPs. A) Morphology of miR-34a mimic loaded NPs using SEM and TEM. Scale bar shown is 100nm. B) Nanoparticle hydrodynamic size in nm and particle size distribution comparing Blank, miR-34a loaded, and Scr-miR-34a loaded nanoparticles. Surface charge density in mV. C) Loading (picomoles/mg) and release kinetics as % cumulative release of miR-34a loaded NPss in PBS. D) In vitro release RNA integrity. miRNA mimic released from nanoparticles over 48hrs in PBS. Absorbance measured at 260nm. Results qualitatively assessed by polyacrylamide gel electrophoresis.
Figure 2: Cell culture studies in the A549 cell line to test miR-34a NP efficacy. A) Cellular uptake of FITC conjugated miR-34a mimic formulations after 24hrs in A549 cells using confocal microscopy. miR-34a-FITC delivered via PLGA-poly-L-His NPs at a 2mg/ml dose. White arrow points to green puncti, representing miR-34a-FITC NPs undergoing endosomal entrapment. Image was taken at 100X. Scale bar represents 50µM. Stacked histogram of FACS analysis to quantify cellular uptake of miR-34a-FITC NPs after 24hrs in A549 cells. B) miR-34a expression of RNA isolated from A549 cells after treated with Scr-miR-34a mimic and miR-34a mimic NPs for 24hrs at a 2mg/ml dose. Data is shown as n=3 and error bars indicate SEM. 1% Agarose gel of PCR product shown above data set. C) p53 gene expression of RNA isolated from A549 cells after treated with Scr-miR-34a mimic and miR-34a mimic NPs for 24hrs at a 2mg/ml dose. Data is shown as n=3 and error bars indicate SEM. 1% Agarose gel of PCR product shown above data set. D) Western blot of protein extracted from A549 cells treated with Scramble mimic and miR-34a mimic NPs for 24hrs at a 2mg/ml dose. Data shows p53 protein levels and is normalized to Vinculin levels. Data shows n=3 and error bars indicate SEM. Protein blots indicate protein intensity based on pixels per band. E) Apoptosis of miR-34a NP treated A549 cells using an Annexin/7-amino acid-actinomycin (7-AAD )based assay. Cells were treated with Blank (nonencapsulated) and miR-34a NPs and Scr-34a NPs for 24hrs at a 2mg/ml dose. The cells undergoing apoptosis and necrosis were stained with Annexin, which was labeled with Phycoerythrin (PE) and 7-AAD, which stain apoptotic and necrotic cells respectively. The quadrants of the dot plots represent necrotic (Q1), late-stage apoptosis (Q2), early apoptosis (Q3), and live cells (Q4). The data was quantified using FlowJo to calculate the total percentage Apoptotic/ cells. The data is shown as n=3 and error bars represent SEM. F) A549 Colony forming efficiency of miR-34a NP treated cells. Cells were treated were either treated with Blank NPs, miR-34a NPs, or Scr NPs for 24hrs at a 2mg/ml dose. Treated cells were re-seeded and colonies were stained with crystal violet after 13 days of growth. Number of colonies was represented by the crystal violet stain. Bar graph shows data where number of colonies is normalized to Blank NP treated cells. Data represents n=3 and error bars represent SEM.
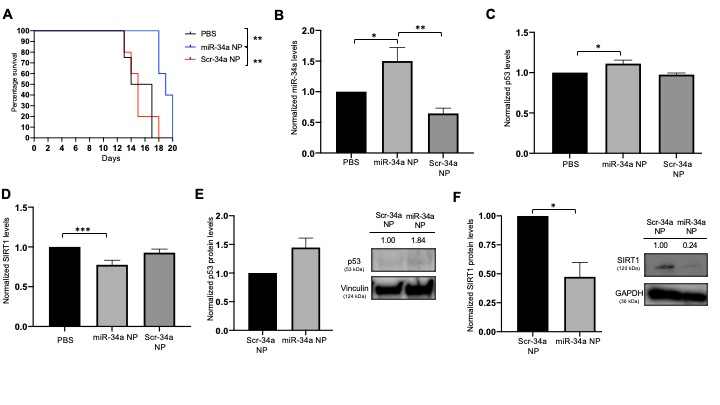
Figure 3: In vivo intratumoral efficacy. A) Survival curve for all A549 xenograft tumors. Survival point was 2000mm3 and plotted against number of days. B) miR-34a gene expression in tumor samples. Data is plotted normalized to PBS treated tumors. Data is shown as n>5 and error bars represent SEM. C) p53 gene expression in tumor samples. Data is plotted normalized to PBS treated tumors. Data is shown as n>5 and error bars represent SEM. D) SIRT1 gene expression in tumor samples. Data is plotted normalized to PBS treated tumors. Data is shown as n>5 and error bars represent SEM. E) p53 protein analysis by Western blot. Vinculin was used as the endogeneous control. Band intensity was quantified with ImageJ software. F) SIRT1 protein analysis by Western blot. GAPDH was used as the endogeneous control. Band intensity was quantified with ImageJ software.

.jpg)