
Poster Session C
Fibrosing rheumatic diseases (scleroderma, MCTD, IgG4-related disease, scleroderma mimics)
.jpg "Brian Skaug, MD, PhD photo")
Brian Skaug, MD, PhD
University of Texas McGovern Medical School at Houston
Houston, TX, United States
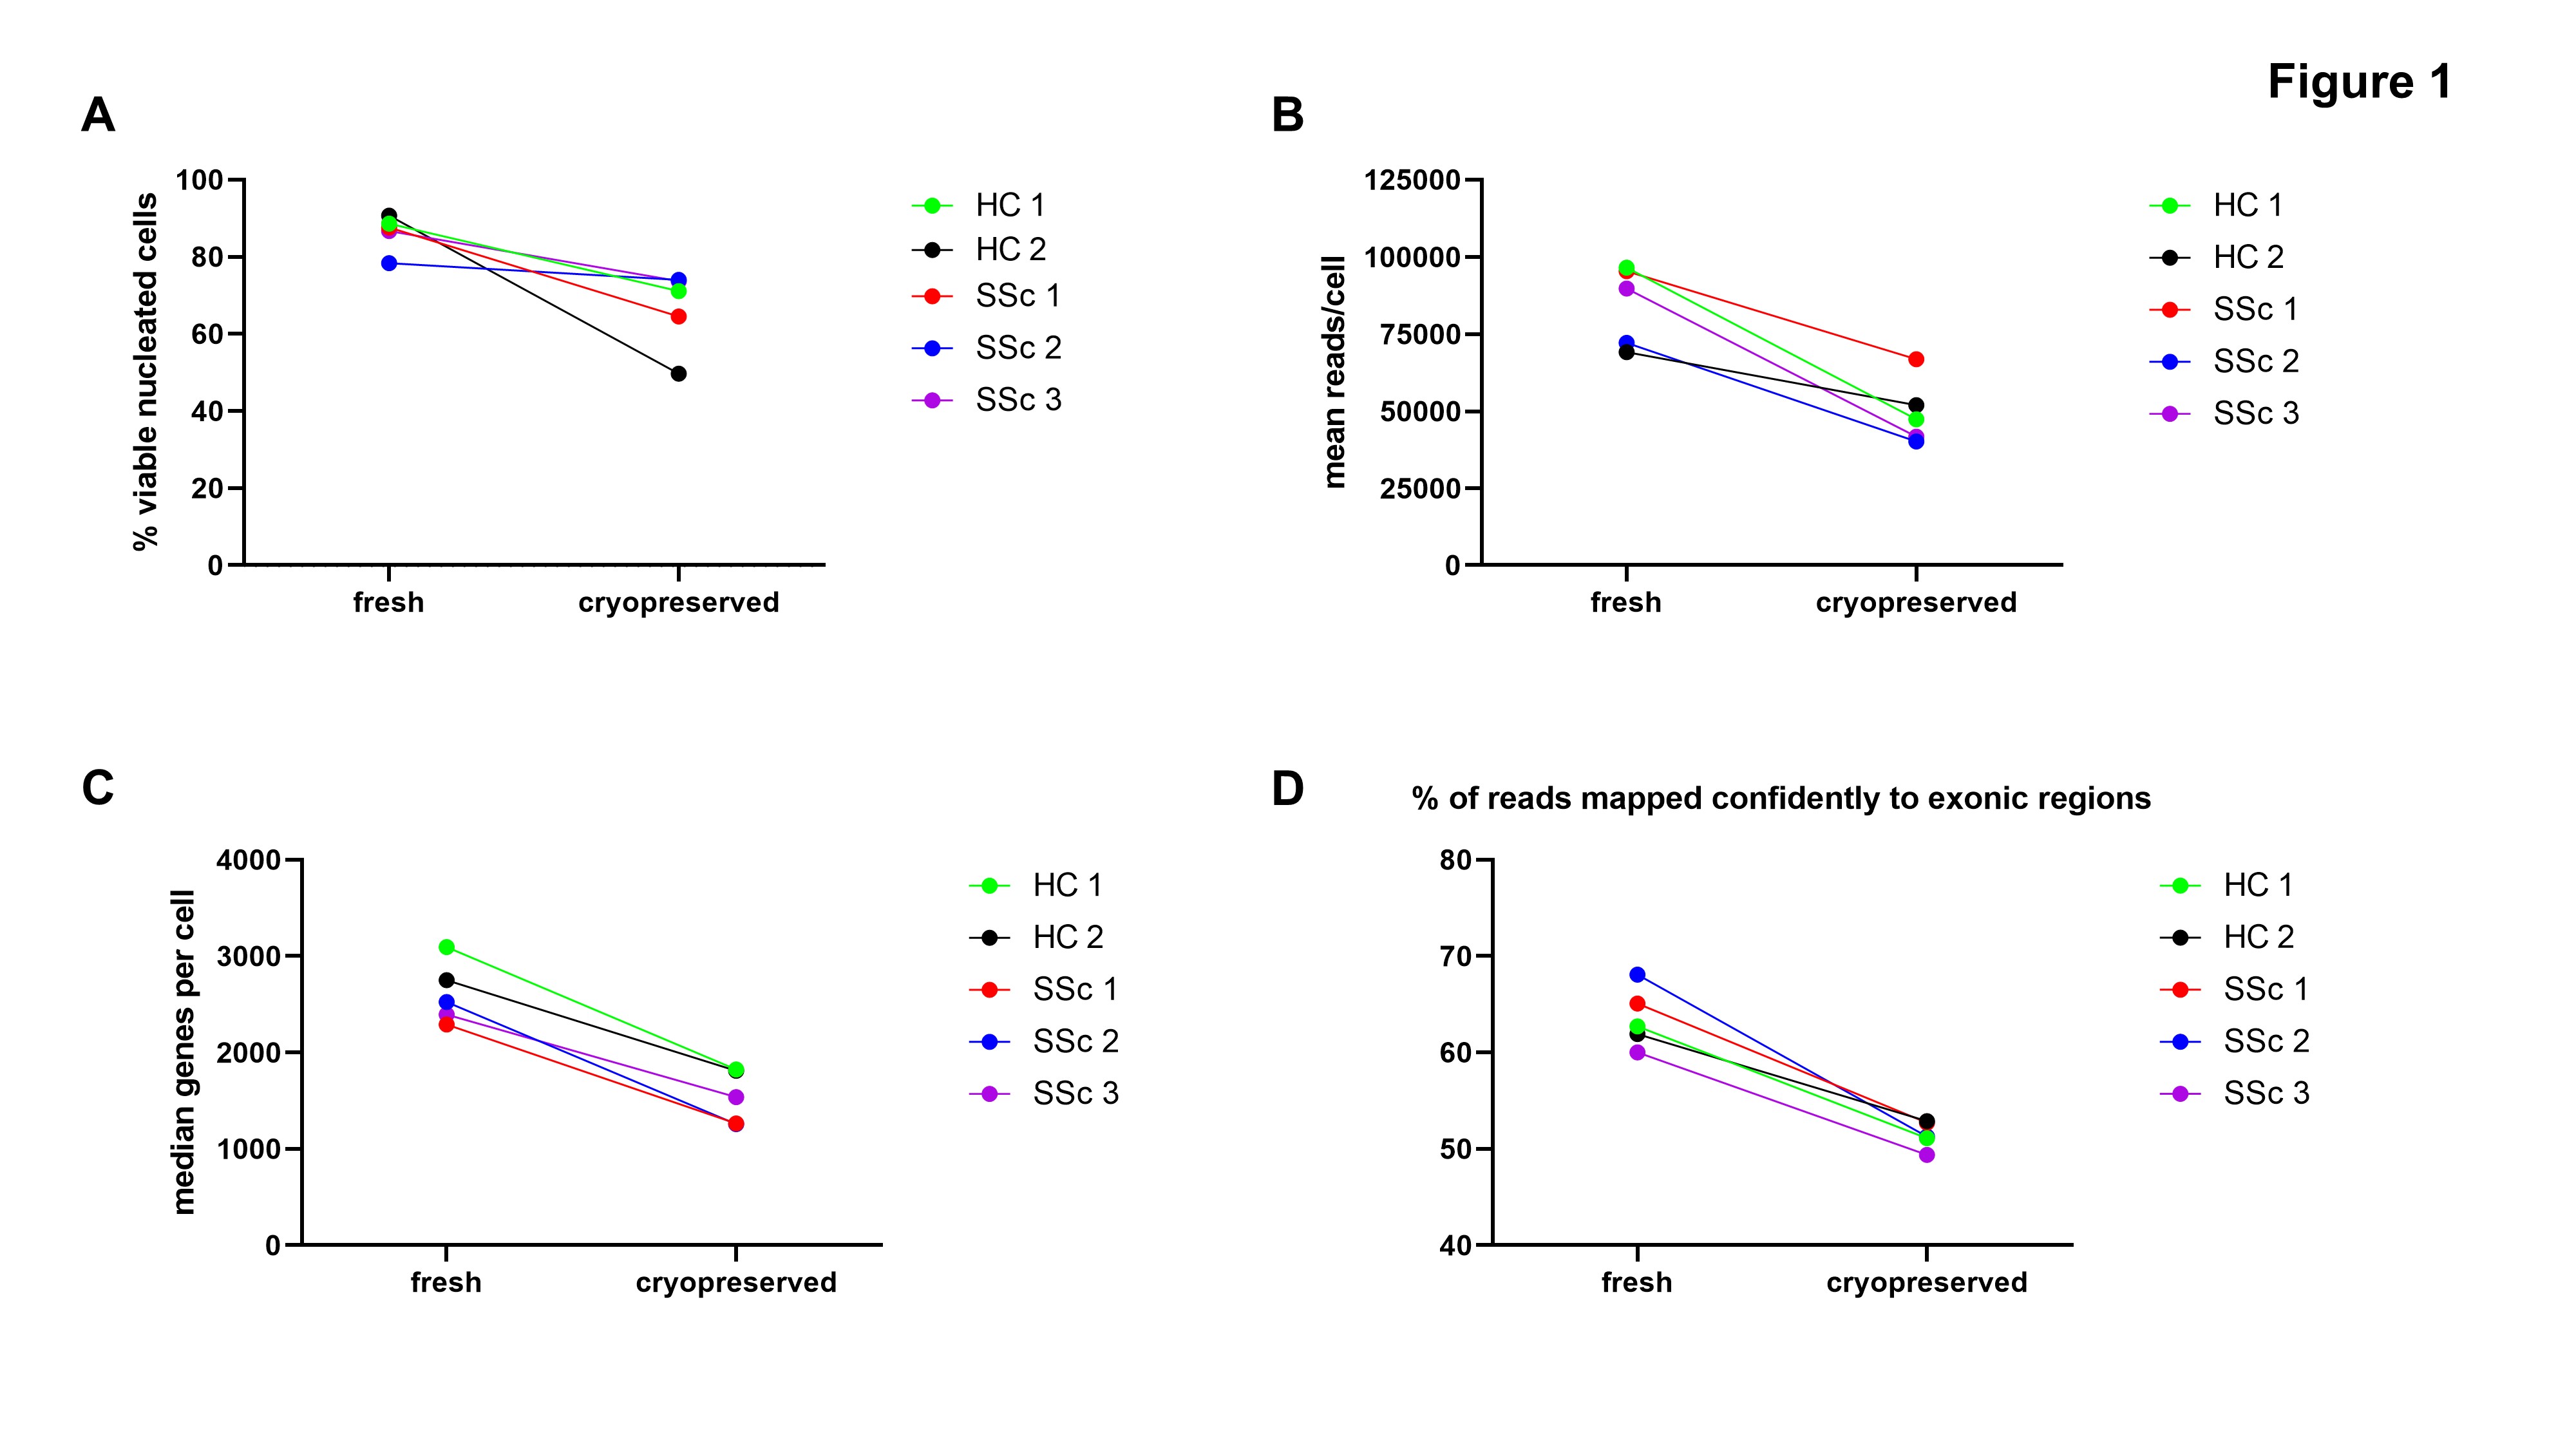 Figure 1: (A) Viability of nucleated cells from fresh vs. cryopreserved skin samples after skin dissociation. (B-D) Quality metrics after single cell RNA Sequencing of fresh vs. cryopreserved samples. HC: healthy control, SSc: systemic sclerosis
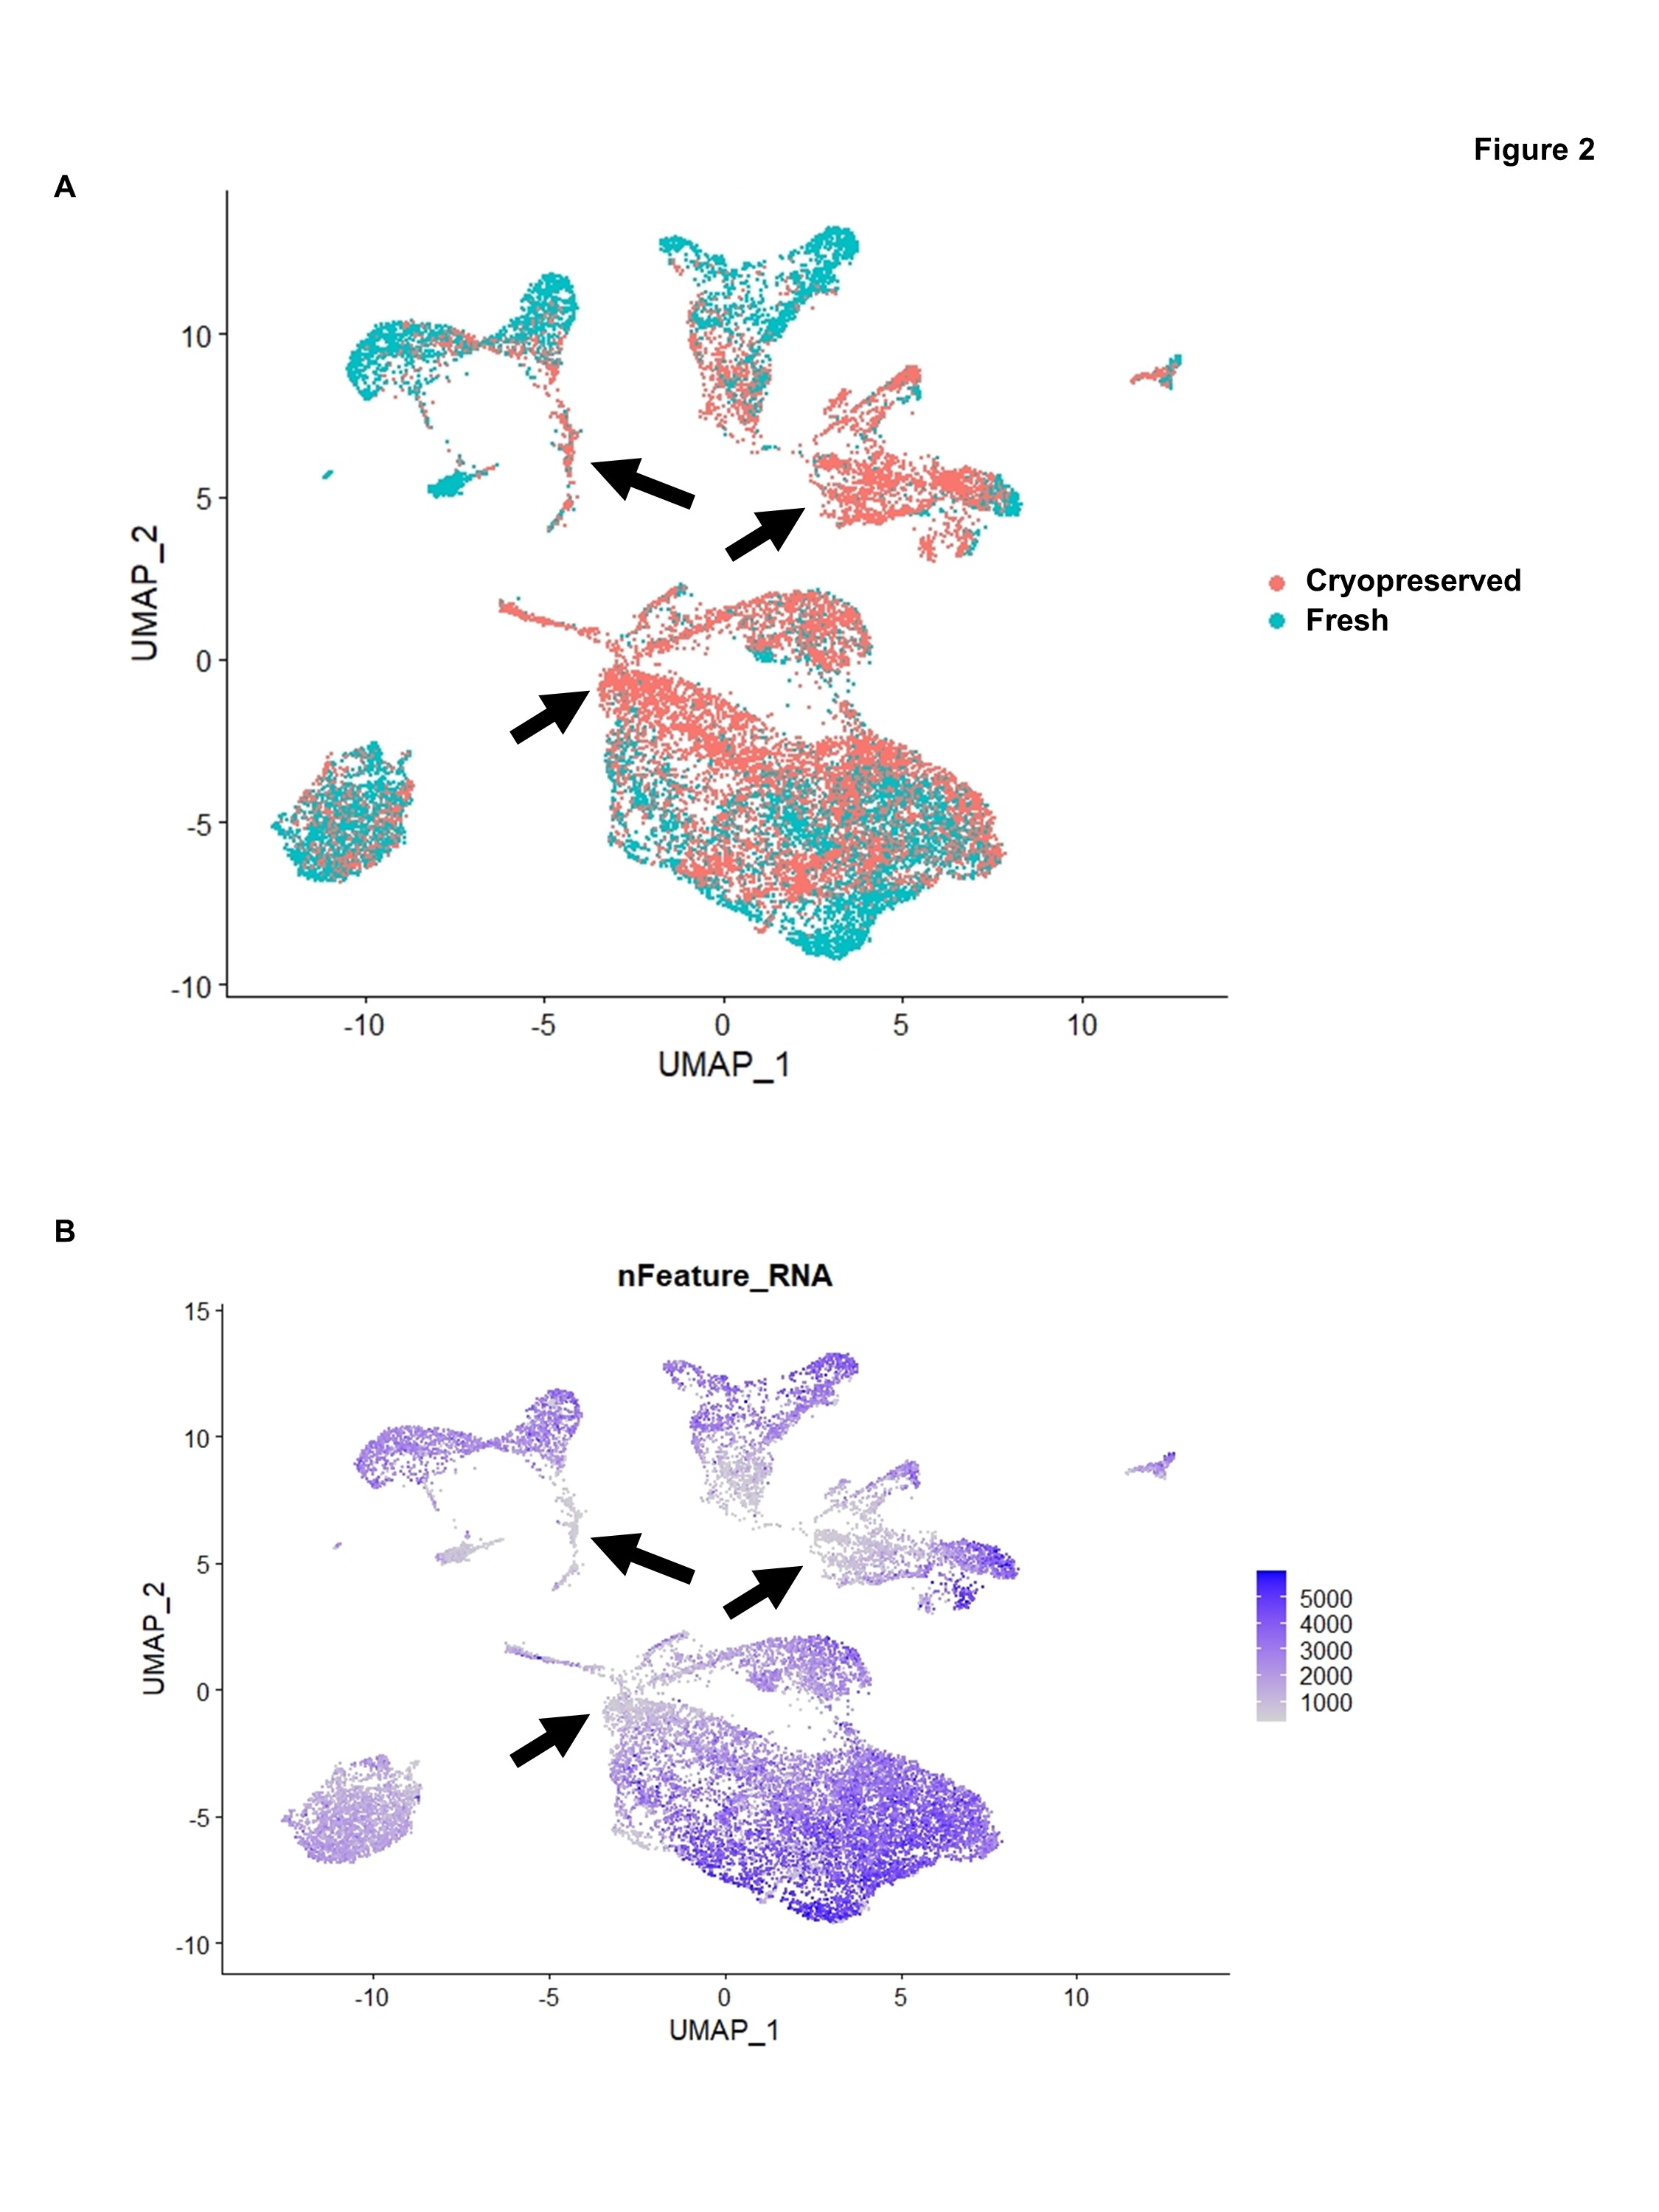 Figure 2: (A) UMAP display of cells from all five biopsy pairs, highlighting cells from fresh vs. cryopreserved samples. (B) Same as (A), but highlighting nFeature RNA, which corresponds to the number of genes per cell. Black arrows indicate groups of cells with low nFeature RNA that are made up predominantly of cells from cryopreserved samples.
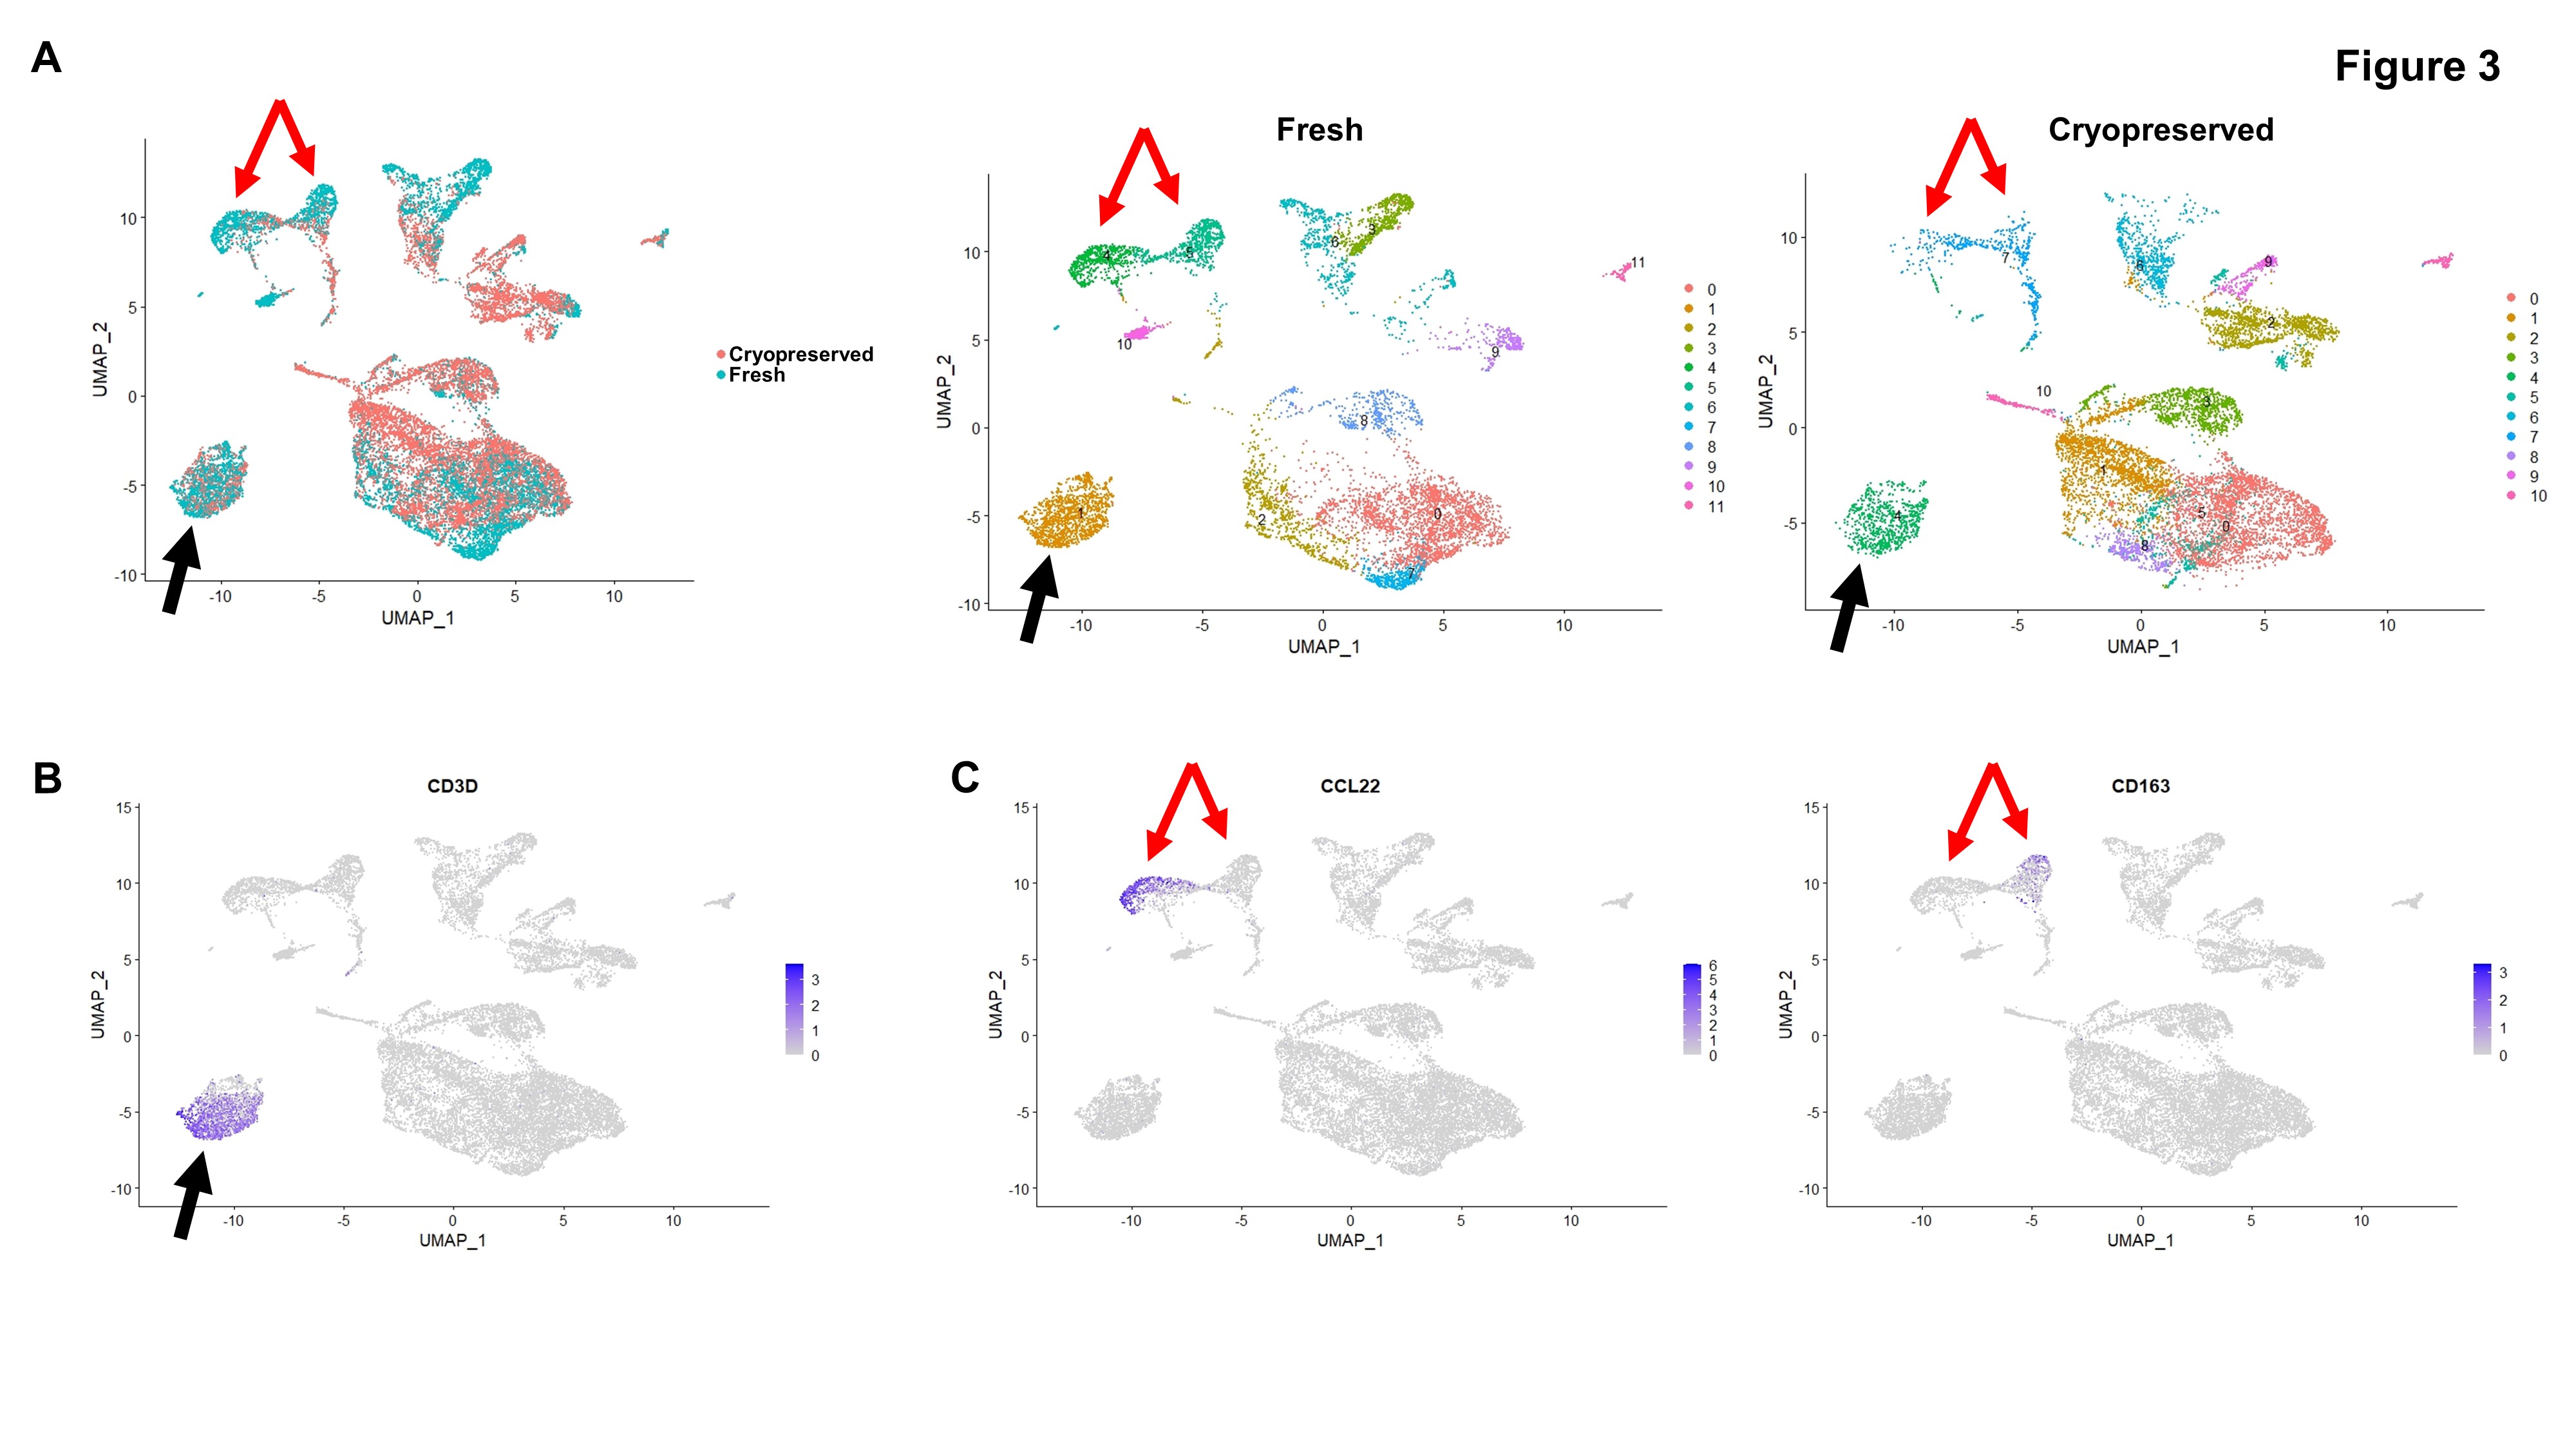 Figure 3: (A) Left: UMAP display of cells from all five biopsy pairs, highlighting cells from fresh vs. cryopreserved samples (Same as Figure 2A). Right: Clusters of cells identified based on gene expression profiles in fresh vs. cryopreserved samples. Black and red arrows indicate areas that are highlighted in Figure 3B (black arrow) and 3C (red arrows). (B) Feature plot showing CD3-expressing cells. (C) Feature plots showing CCL22- and CD163-expressing cells.