
Poster Session C
Spondyloarthritis (SpA) including psoriatic arthritis (PsA)

Rochelle Castillo, MD, MS
NYU Langone Health
New York, NY, United States
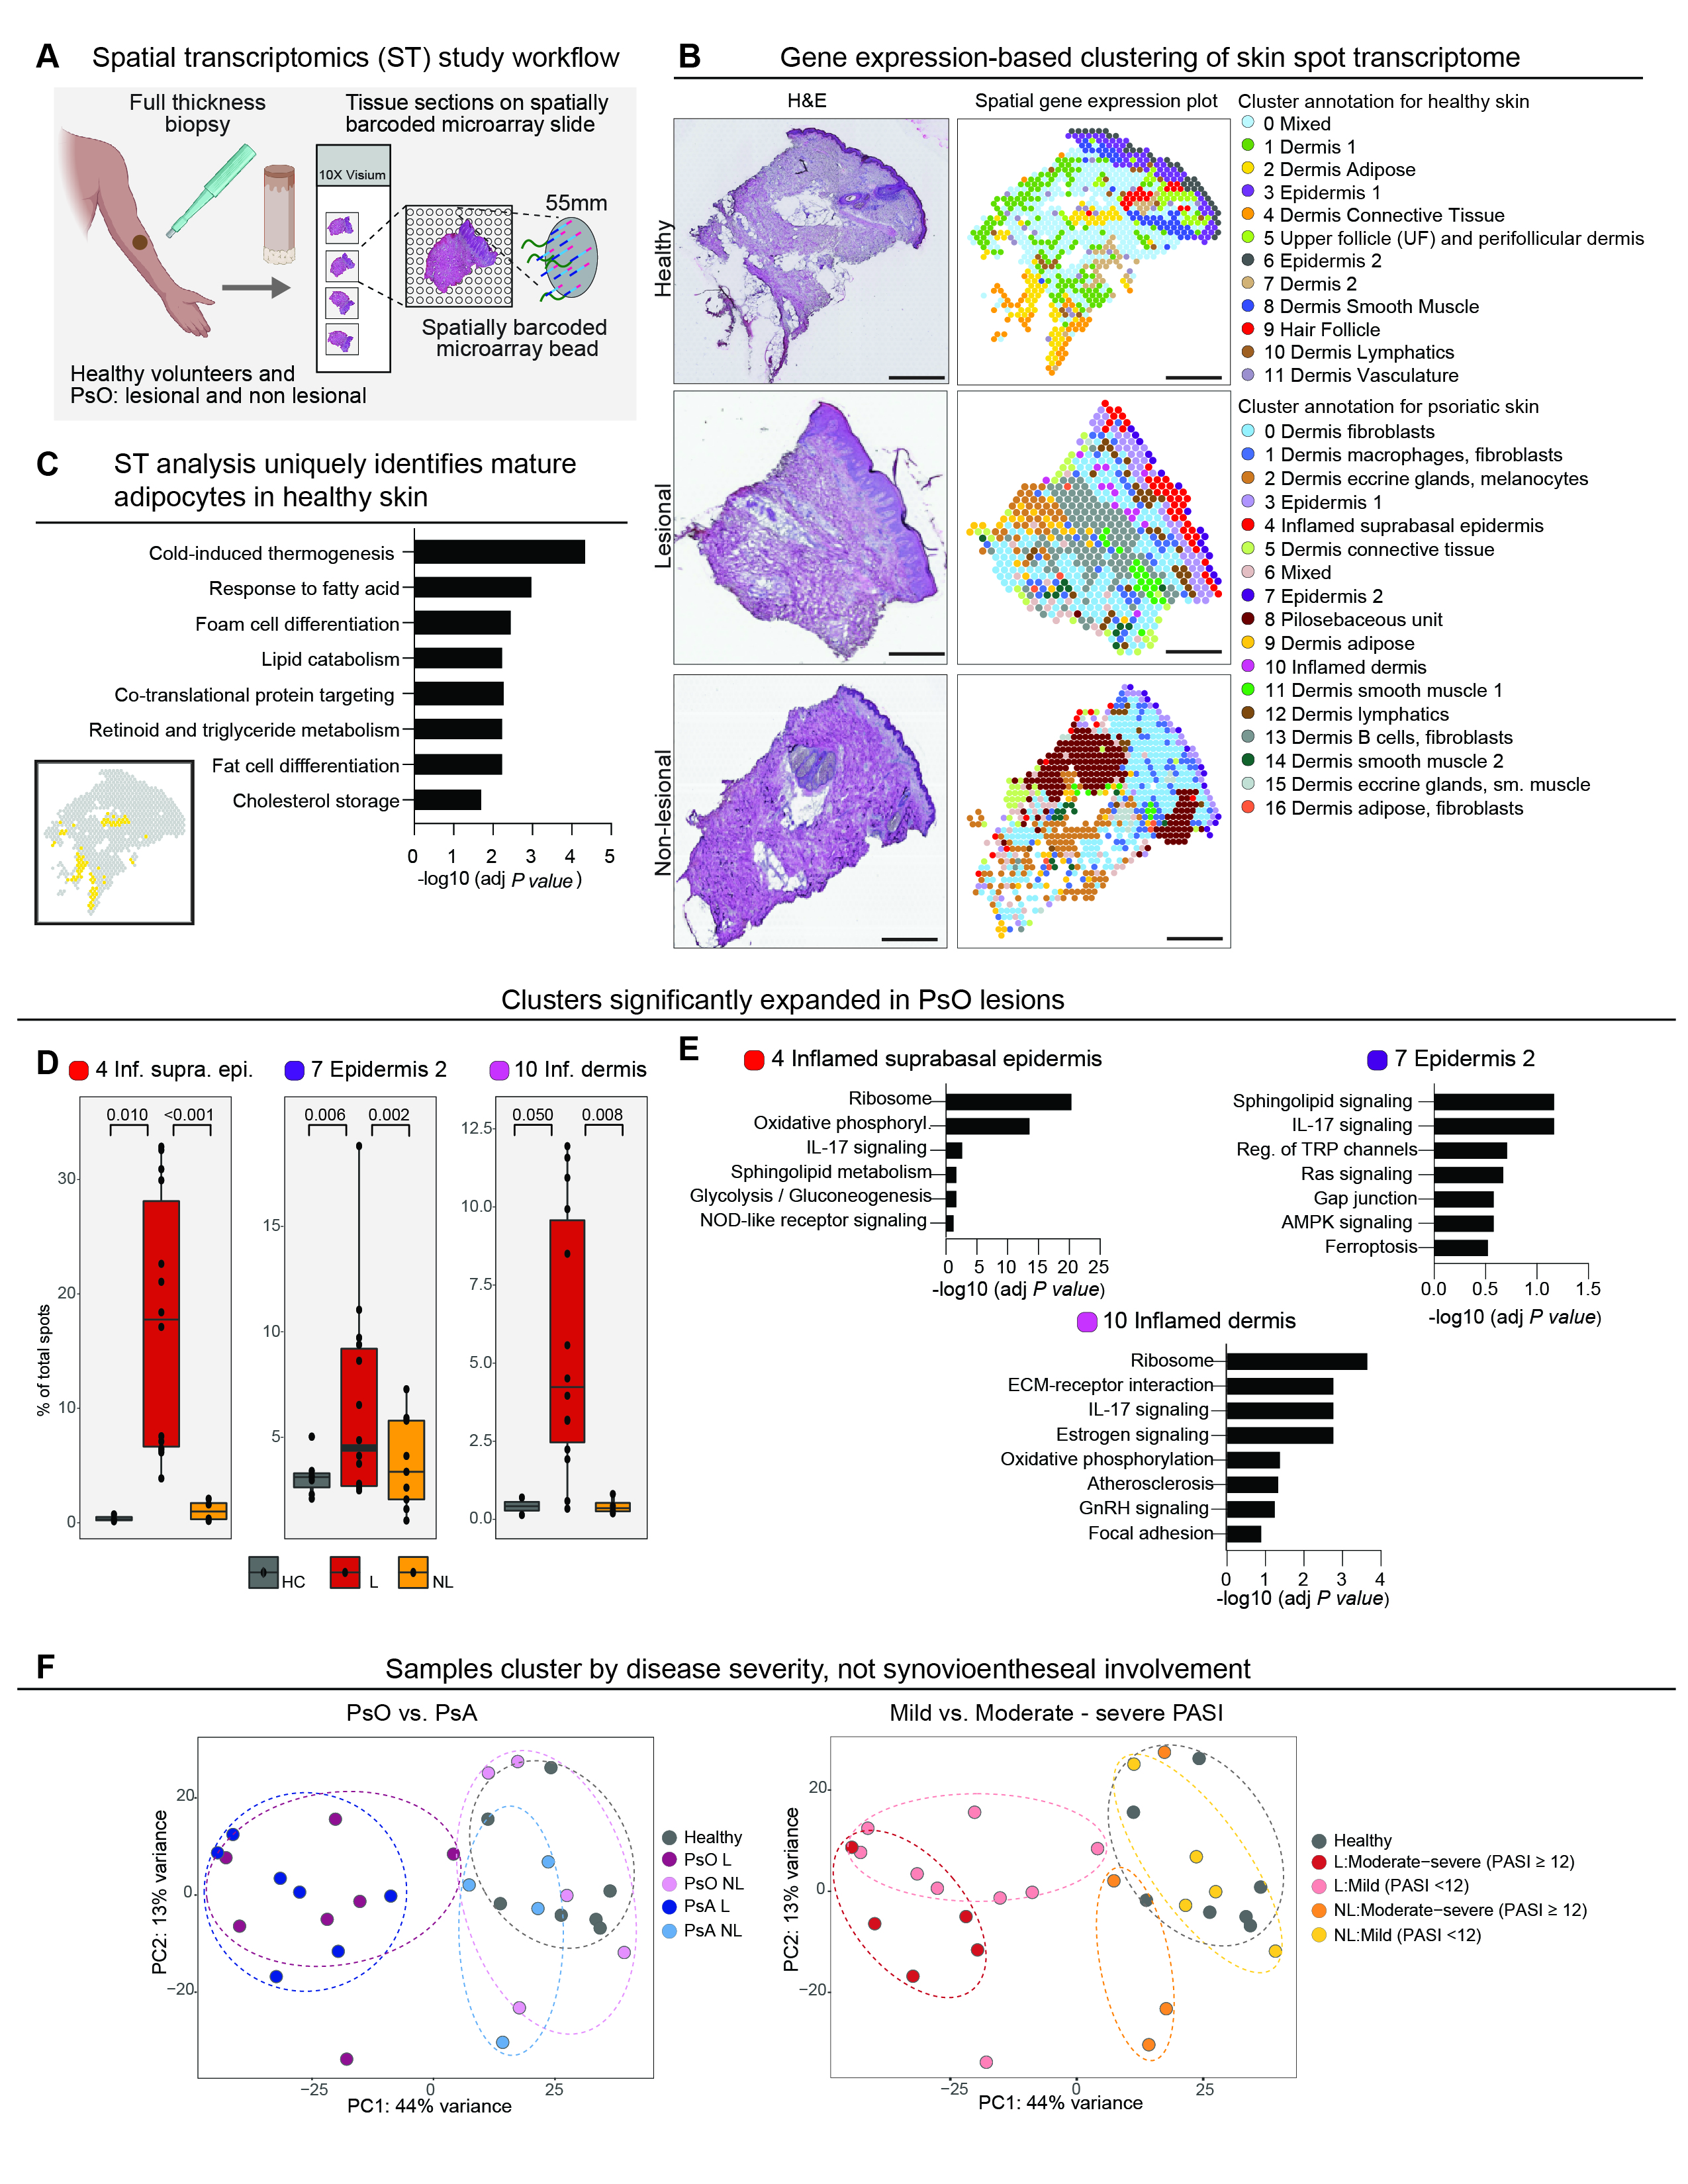 Fig. 1. (A) Schematic of spatial transcriptomics study workflow. Four mm skin punch biopsies were obtained from healthy volunteers (n=3) and lesional and non-lesional skin from patients with psoriatic disease (n=11). Ten micron-thick sections were then placed on capture areas on the ST microarray slide, each containing molecularly barcoded, spatially encoded spots with a diameter of 50 microns and a center-to-center distance of 100 microns. (B) Side-by-side comparison of a hematoxylin-eosin (H&E) stained section of representative healthy, lesional, and non-lesional skin samples and the corresponding ST plots showed concordance of unbiased gene expression-based clustering with histologic tissue architecture. (C) Pathway analysis of the adipose cluster in healthy skin (cluster 2) confirmed upregulation of lipid-associated processes. Inset: Spots corresponding to the adipose cluster highlighted in yellow. (D) Wilcoxon rank sum test (results displayed as box plots) yielded statistically significant expansion of three clusters in lesional skin compared to both non-lesional and healthy skin – inflamed suprabasal epidermis (cluster 4), epidermis 2 (cluster 7), and inflamed dermis (cluster 10). HC=healthy control, L=lesional psoriatic skin, NL=non-lesional psoriatic skin. (E) Pathways enriched in clusters 4, 7, and 10. (F) Principal component analysis (PCA) plots demonstrating segregation of samples by severity of cutaneous disease in both lesional and non-lesional samples along the first principal component (right) that was not seen in the samples categorized according to presence or absence of arthritis (left). PsA=psoriatic arthritis, PsO=skin-limited psoriasis.
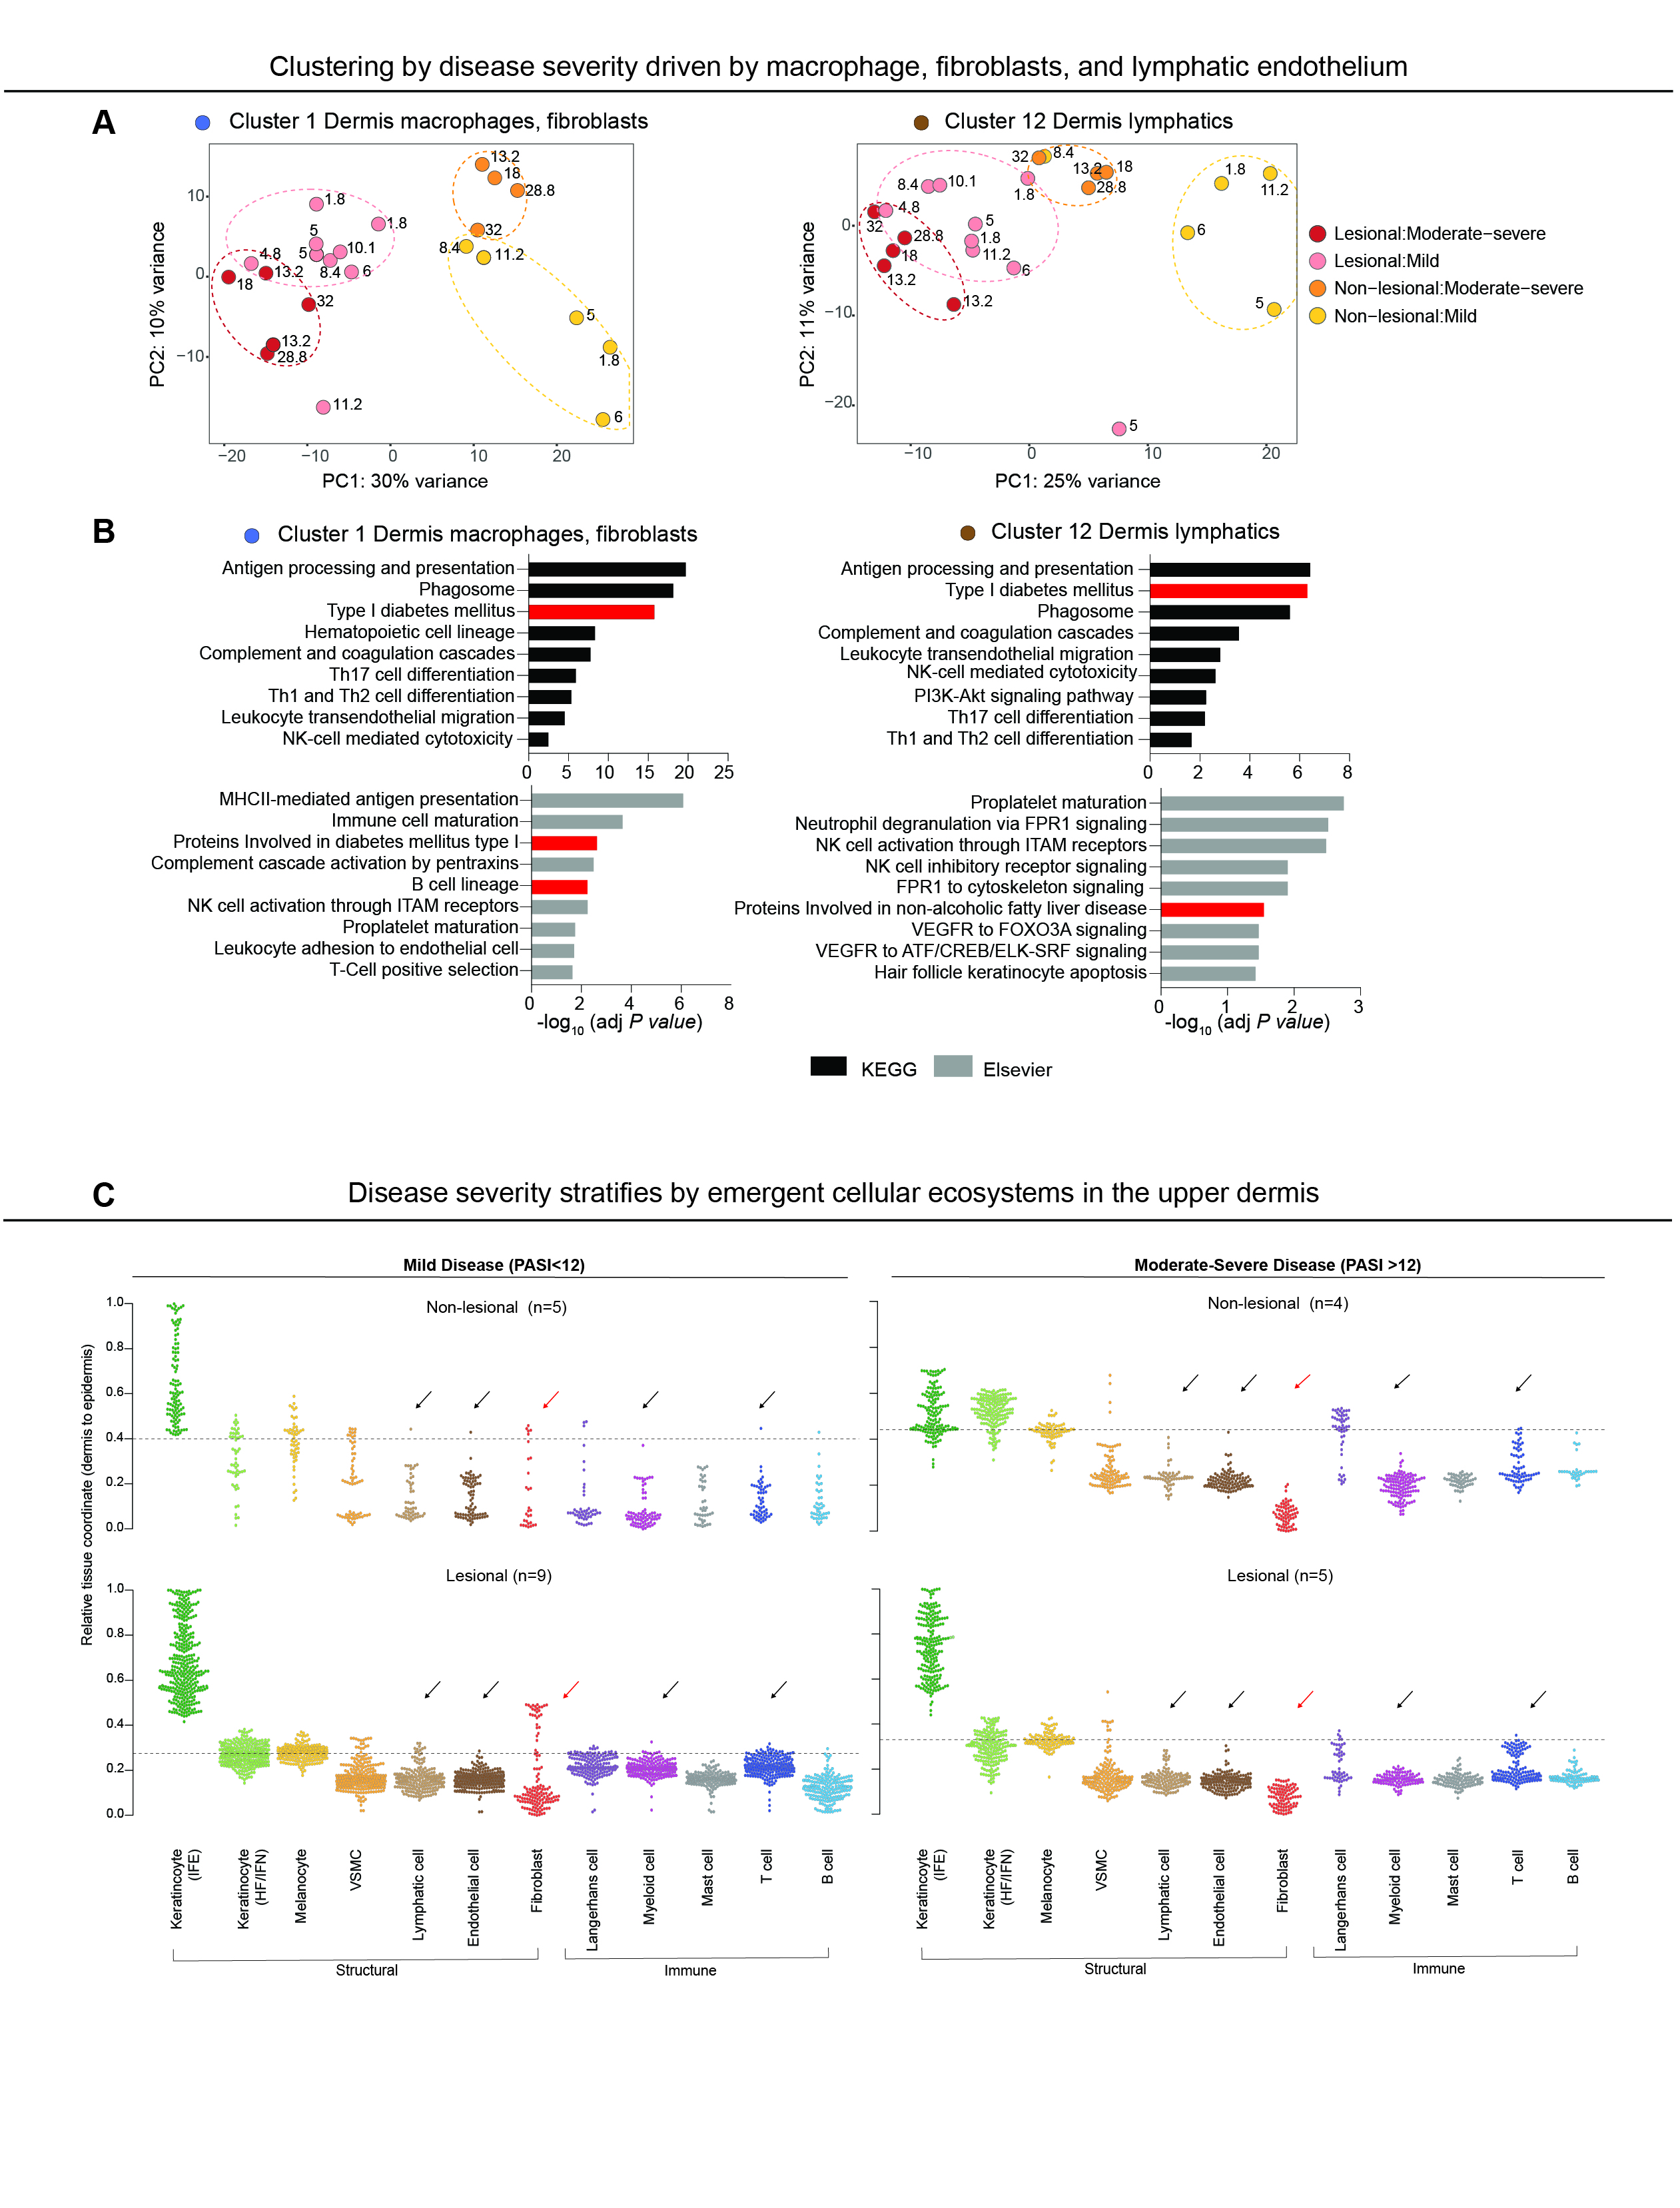 Fig. 2. (A) PCA of lesional and non-lesional samples colored by disease severity in spatial clusters 1 (left) and 12 (right) revealed more discrete clustering. (B) Pathways significantly enriched in clusters 1 (left) and 12 (right) showed enrichment of pathways associated with key T cell and innate immune cell activation, B cells, and metabolic dysfunction (highlighted in red). (C) SpaceFold one dimension projection of cell distribution from an independently-generated single-cell RNA seq data set on aggregated ST lesional and non-lesional samples from mild (PASI-low) and moderate-severe (PASI-high) samples. Y-axis represents tissue position, starting with the lower dermis marked as position 0 to suprabasal epidermis marked as position 1. Dashed line represents epidermal-dermal junction, discerned by cell types in the basal epidermal layer (melanocytes and Langerhans cells). Fibroblast signatures (red arrows) were largely relegated to the lower dermis in the PASI-high group, but extended to the upper dermis in the PASI-low group. This striking difference in fibroblast localization was also noted in non-lesional PASI-high vs. PASI-low groups. In addition to fibroblasts, lymphatic, endothelial, myeloid, and T cells signatures (black arrows) were also observed in the upper dermis of lesional PASI-low samples, but were much lower in the dermis of PASI-low non-lesional and all samples in the PASI-high group. Interfollicular epidermis (IFE), hair follicle and infundibulum (HF/IFN), n= number of individual biopsies.