
Poster Session C
Genetics, genomics and proteomics
FARAH KAMBEROVIC, MSc
Faculty of Medicine, University of Barcelona
Barcelona, Spain
.jpg) Figure 1. Differentially expressed genes (RNA counts, nCounter) between baseline condition (untreated PBMCs) vs IL-6 stimulation (A) and IL6 group vs TCZ+IL6 group (B).
Figure 1. Differentially expressed genes (RNA counts, nCounter) between baseline condition (untreated PBMCs) vs IL-6 stimulation (A) and IL6 group vs TCZ+IL6 group (B).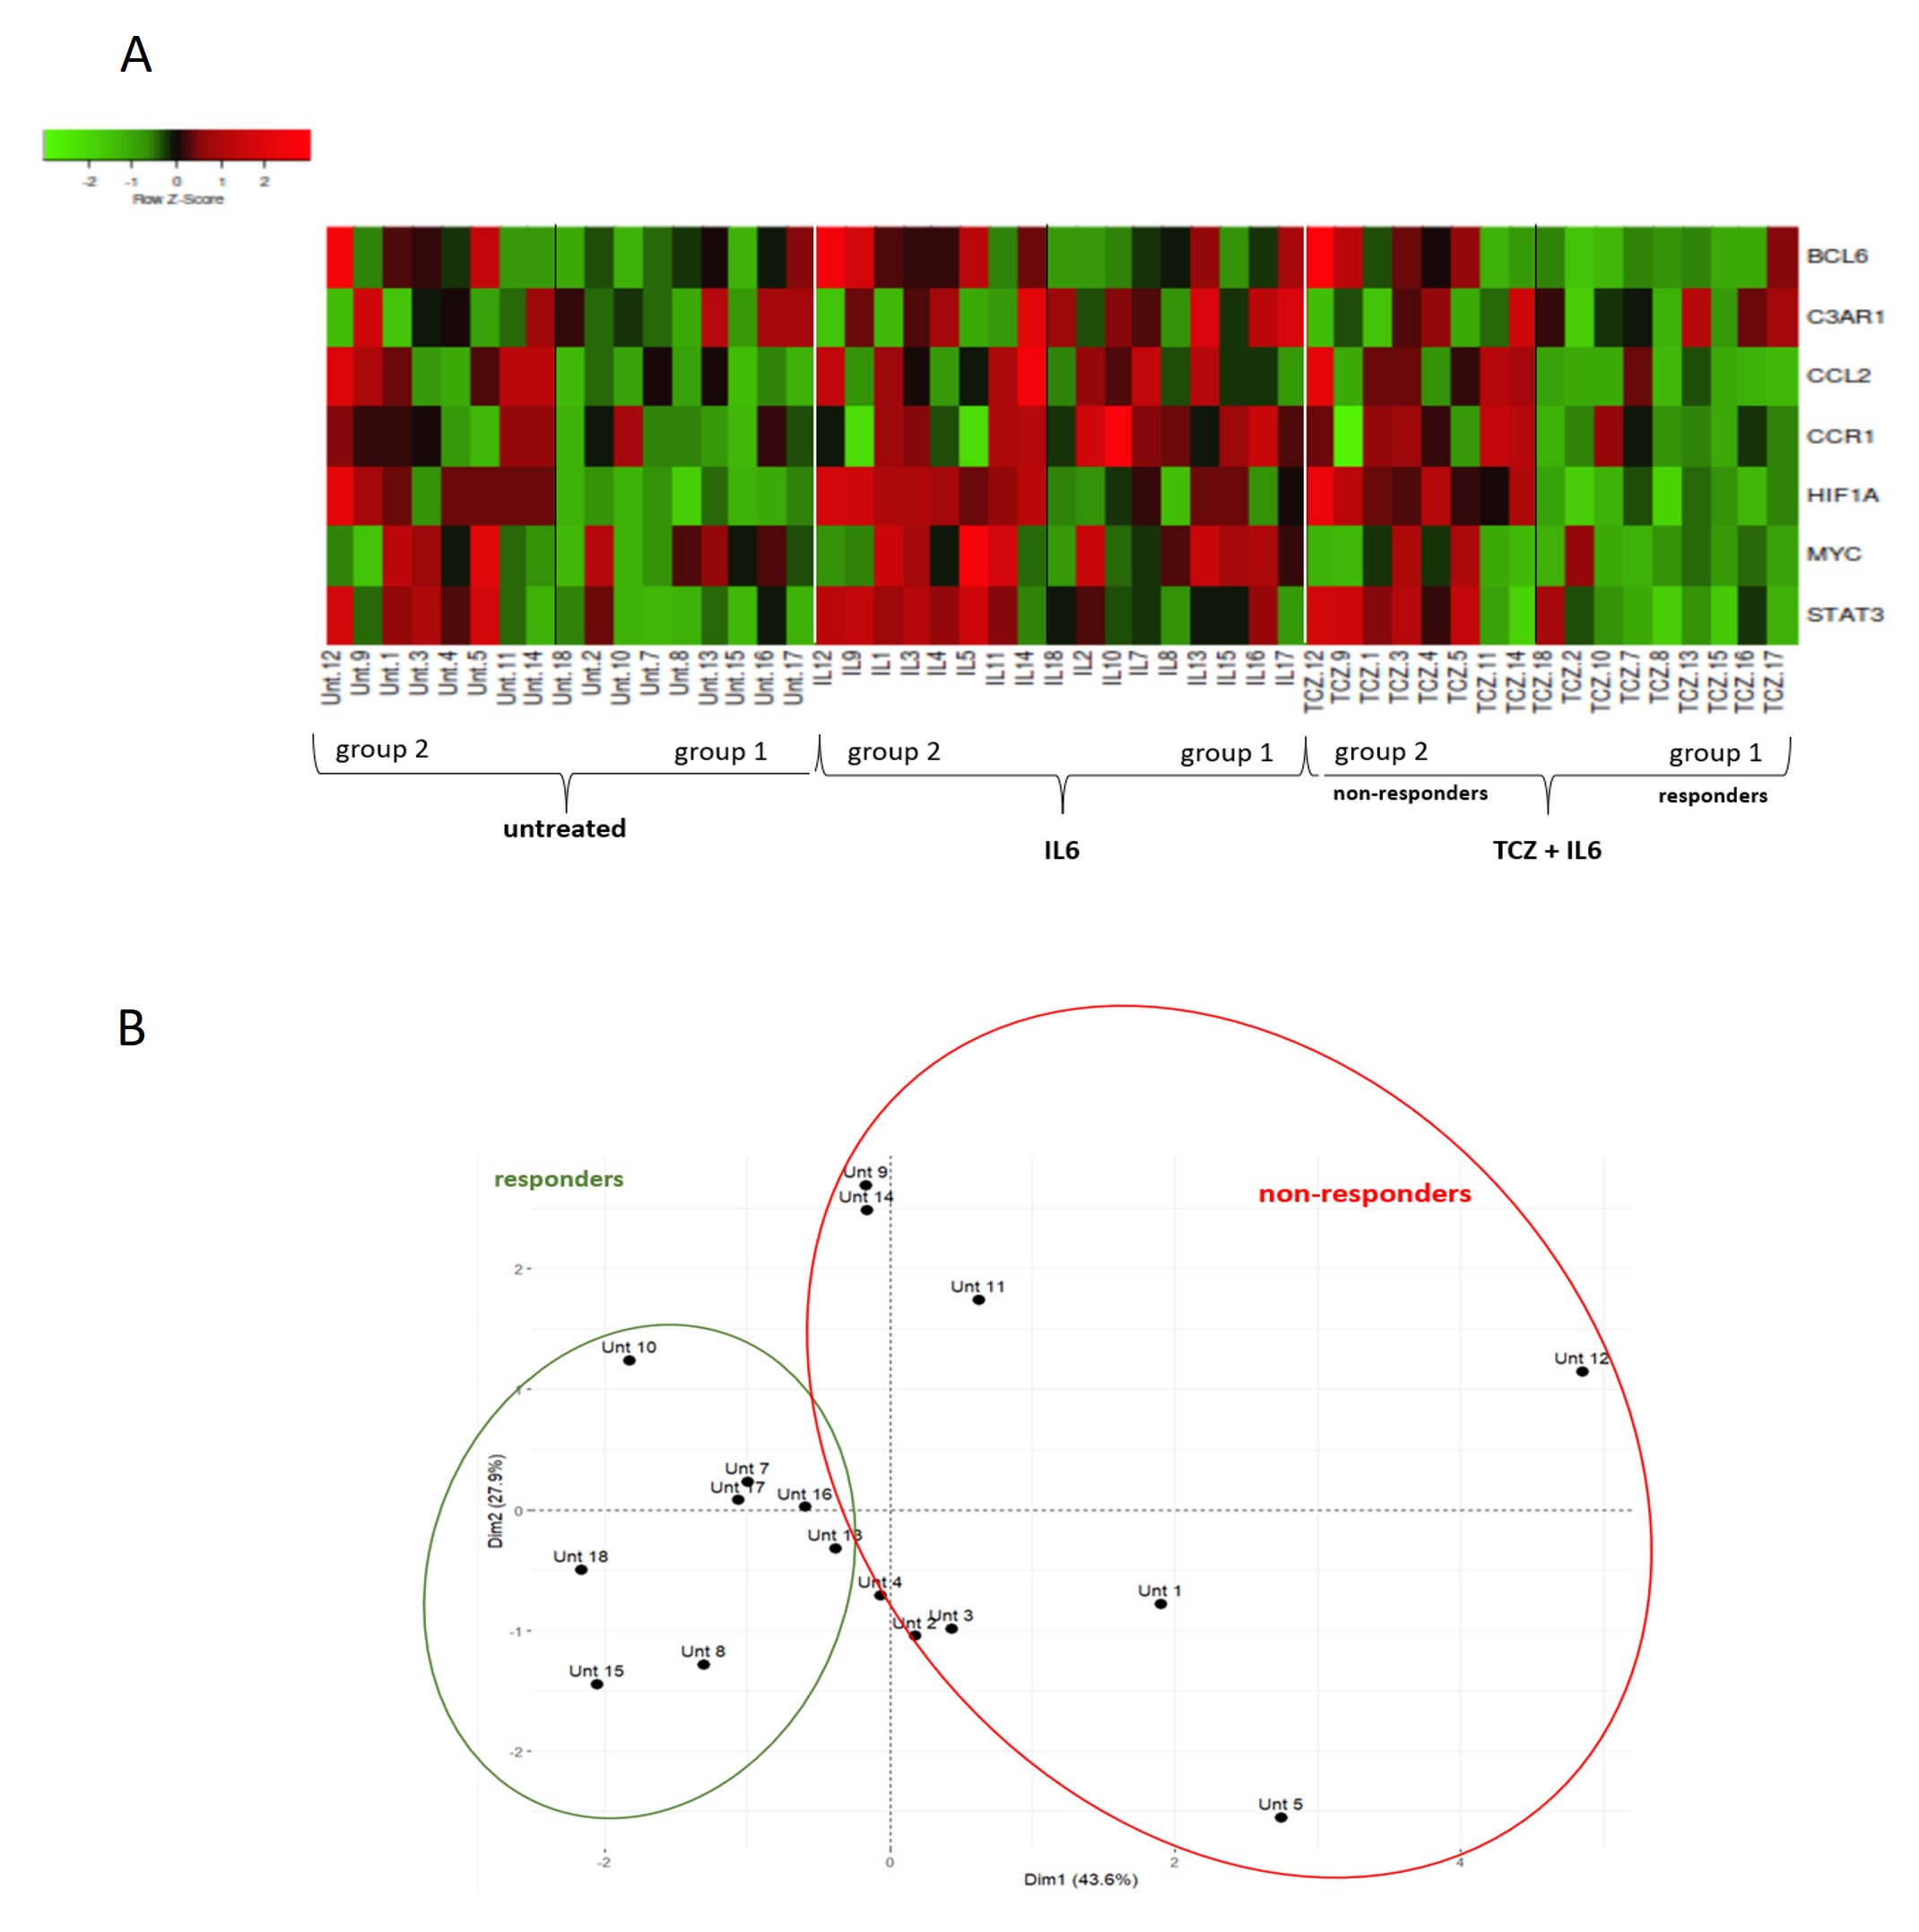 Figure 2. Heatmap (A) and PCA (B) of 7 genes that increased expression with IL-6 stimulation and decreased after exposure to TCZ revealing 2 different groups of patients that respond and cluster differently in response to tocilizumab.
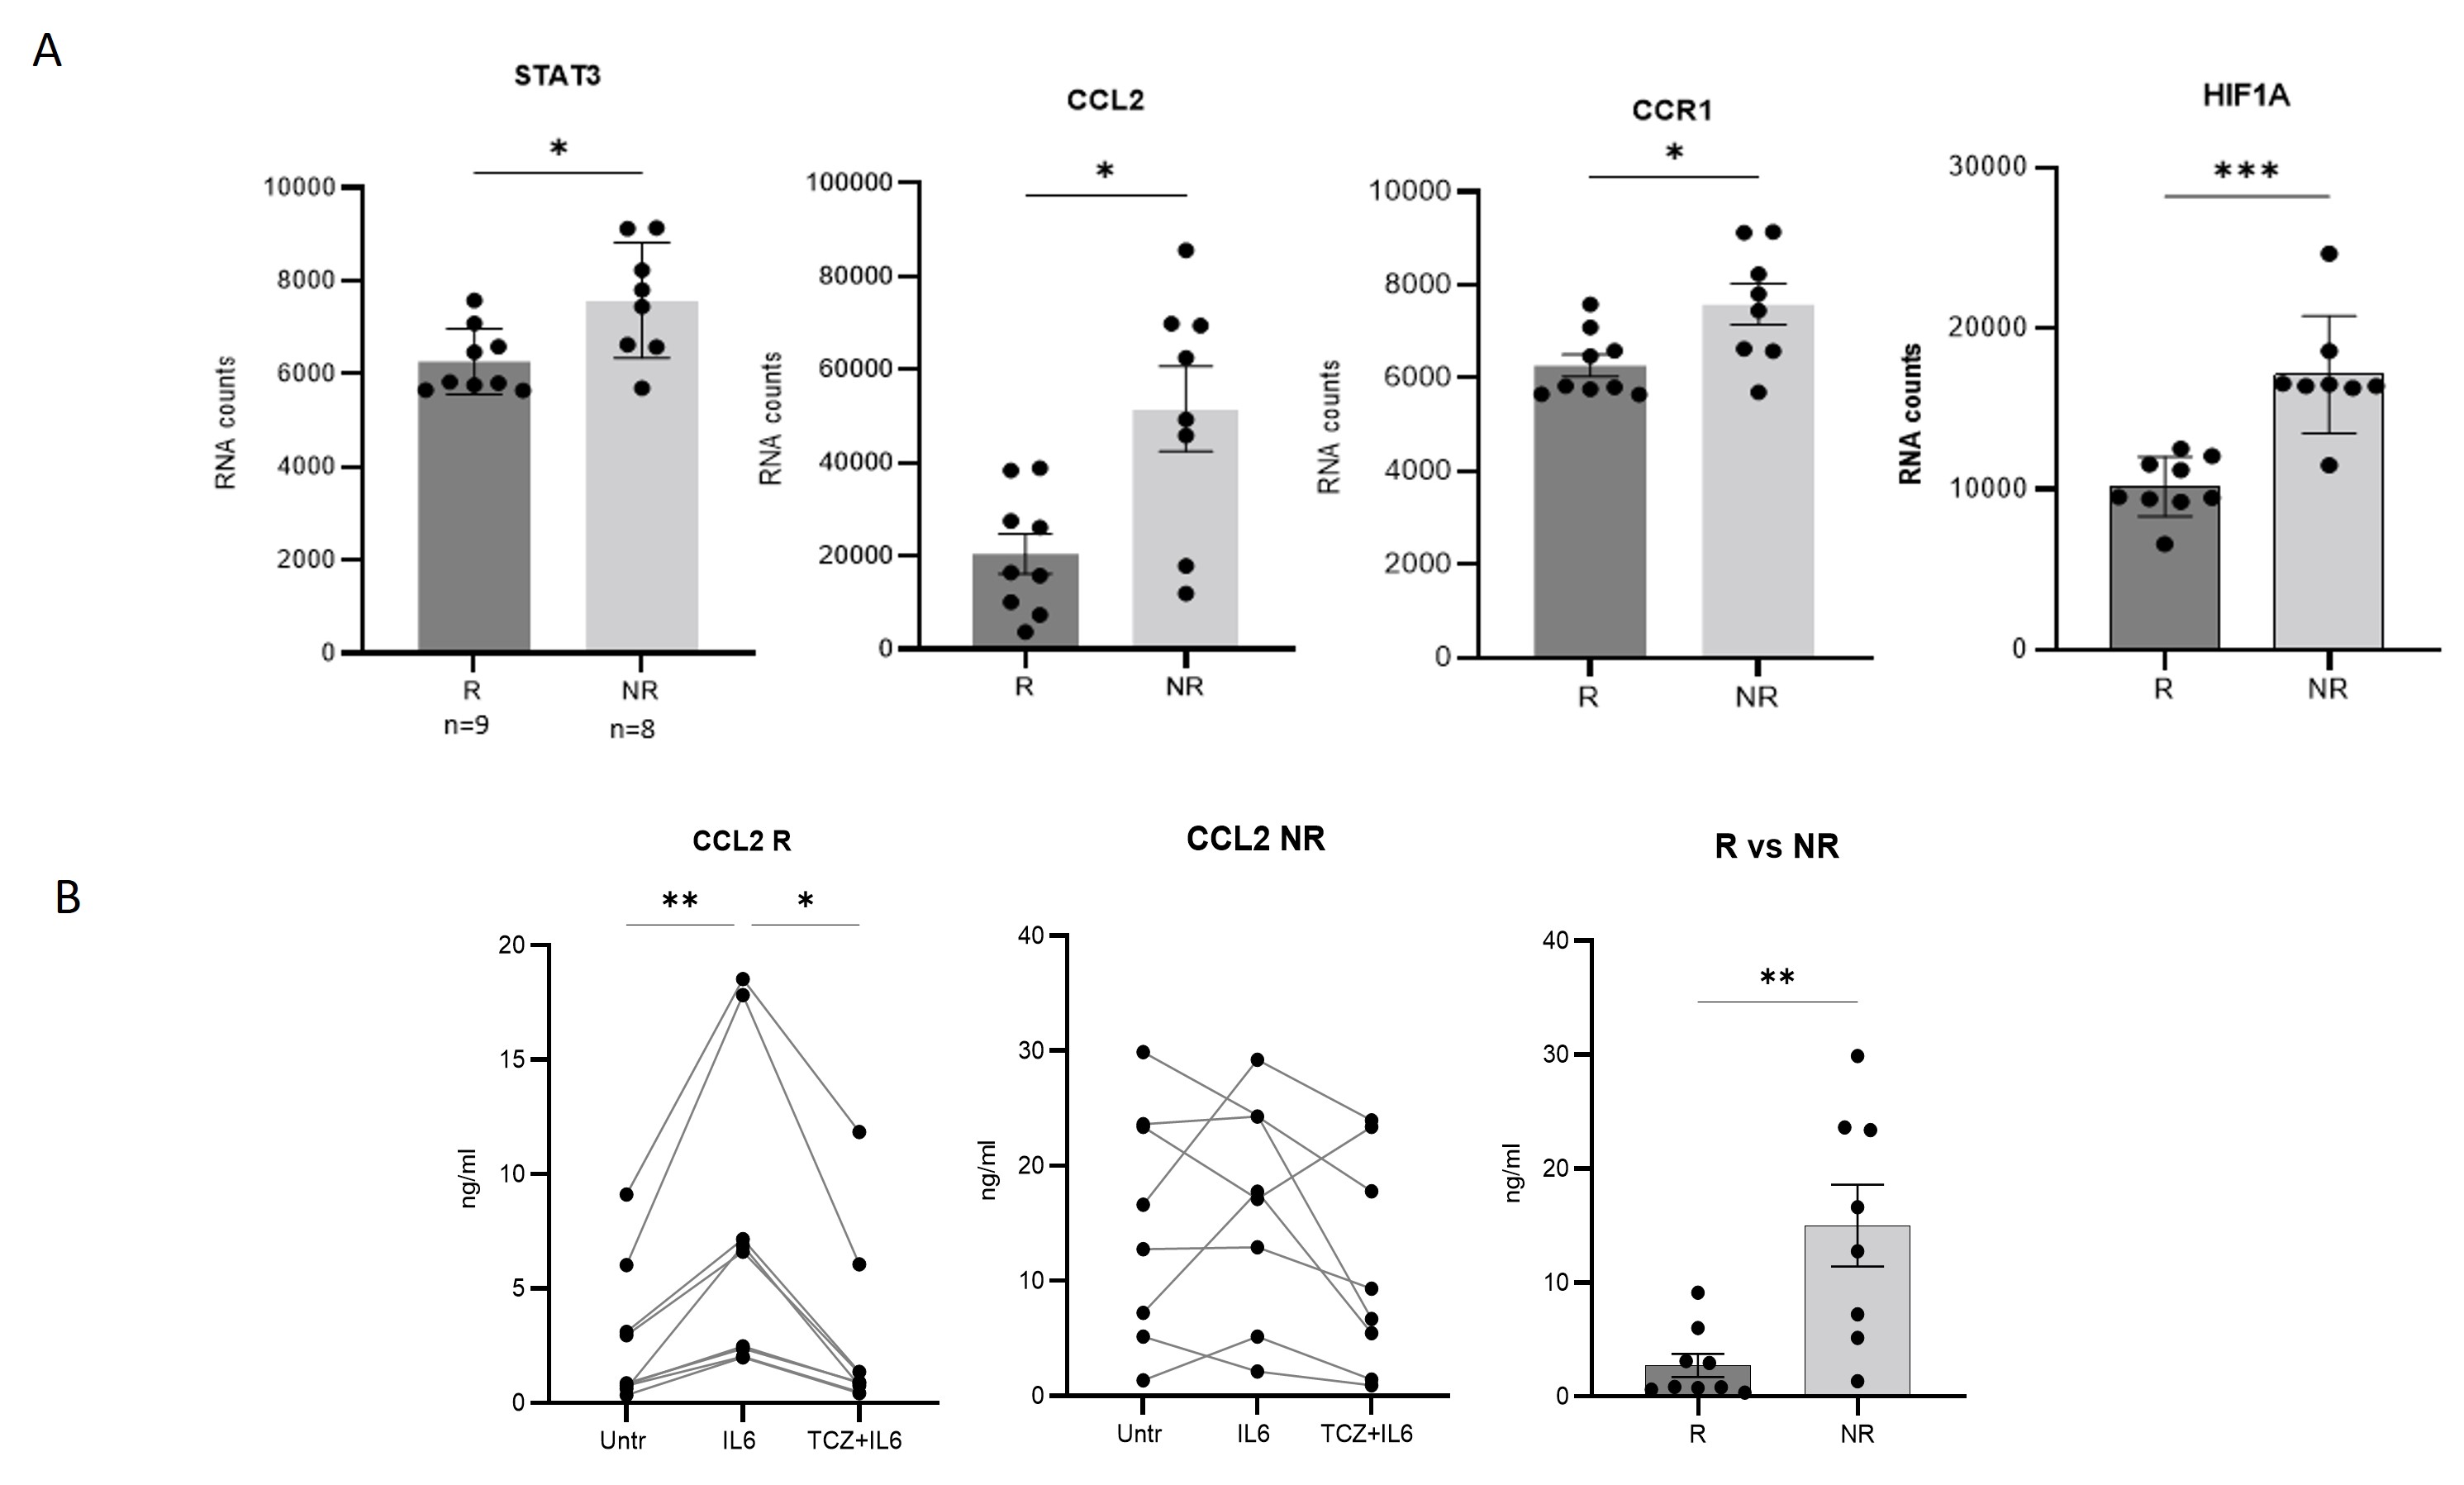 Figure 3. Baseline expression levels of differentially expressed transcripts (STAT3, HIF1A, CCR1 and CCL2) between R and NR (RNA counts)(A) and expression of soluble CCL2 between R and NR on protein level (B).