
Poster Session D
Immunobiology
Eddie James, PhD
Benaroya Research Institute at Virginia Mason
Seattle, WA, United States
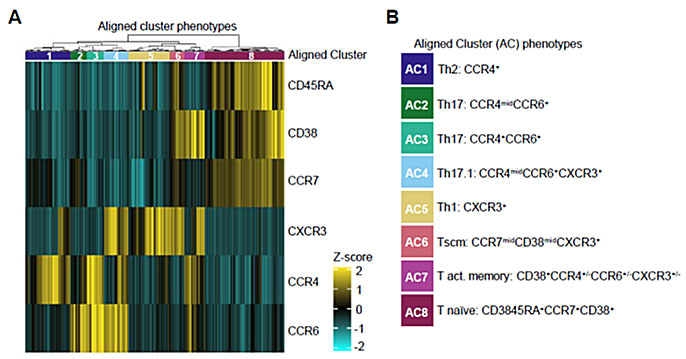 Figure 1. Aligned Clusters Define the CD4+ T cell Phenotypic Landscape. (A) Heat map showing surface marker expression across CD4+ T cell clusters from 66 RA subjects and 30 HC subjects, hierarchically clustered (Euclidean distance, Ward’s minimum variance linkage) with each of six phenotyping markers displayed as a z-score comparing mean cluster intensity to total CD4 T cell intensity for each subject. The resulting dendrogram is sliced into eight aligned clusters with color bar across top indicating aligned cluster assignment. (B) Suggested lineages of aligned clusters (AC) representing the CD4+ T cell landscape.
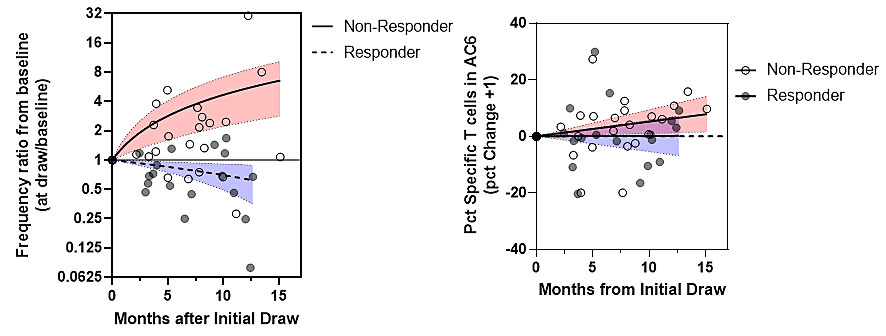 Figure 2. Antigen specific CD4 T cell phenotypes correlate with treatment response. The number and surface phenotype of antigen specific CD4+ T cells was examined through HLA tetramer and surface marker staining of blood samples from responders (RAPID3 reduced to < 2.3 following change in therapy, n=9) and non-responders (maintained RAPID3 > 2.3, n=13) to identify T cell traits that correlate with treatment response. (A) The overall frequency of antigen-specific T cells significantly decreased in responders (p=0.0411, Spearman) but increased in non-responders (p=0.0165, Spearman). (B) The proportion of antigen specific T cells within Tscm-like (CD45RA+CXCR3+) cluster AC6 significantly increased in non-responders (p=0.0033, Spearman) but exhibited no change in responders (p=0.762, Spearman).