
Poster Session D
Immunobiology
Austin Ragland, BS
University of Nebraska Medical Center
Omaha, NE, United States
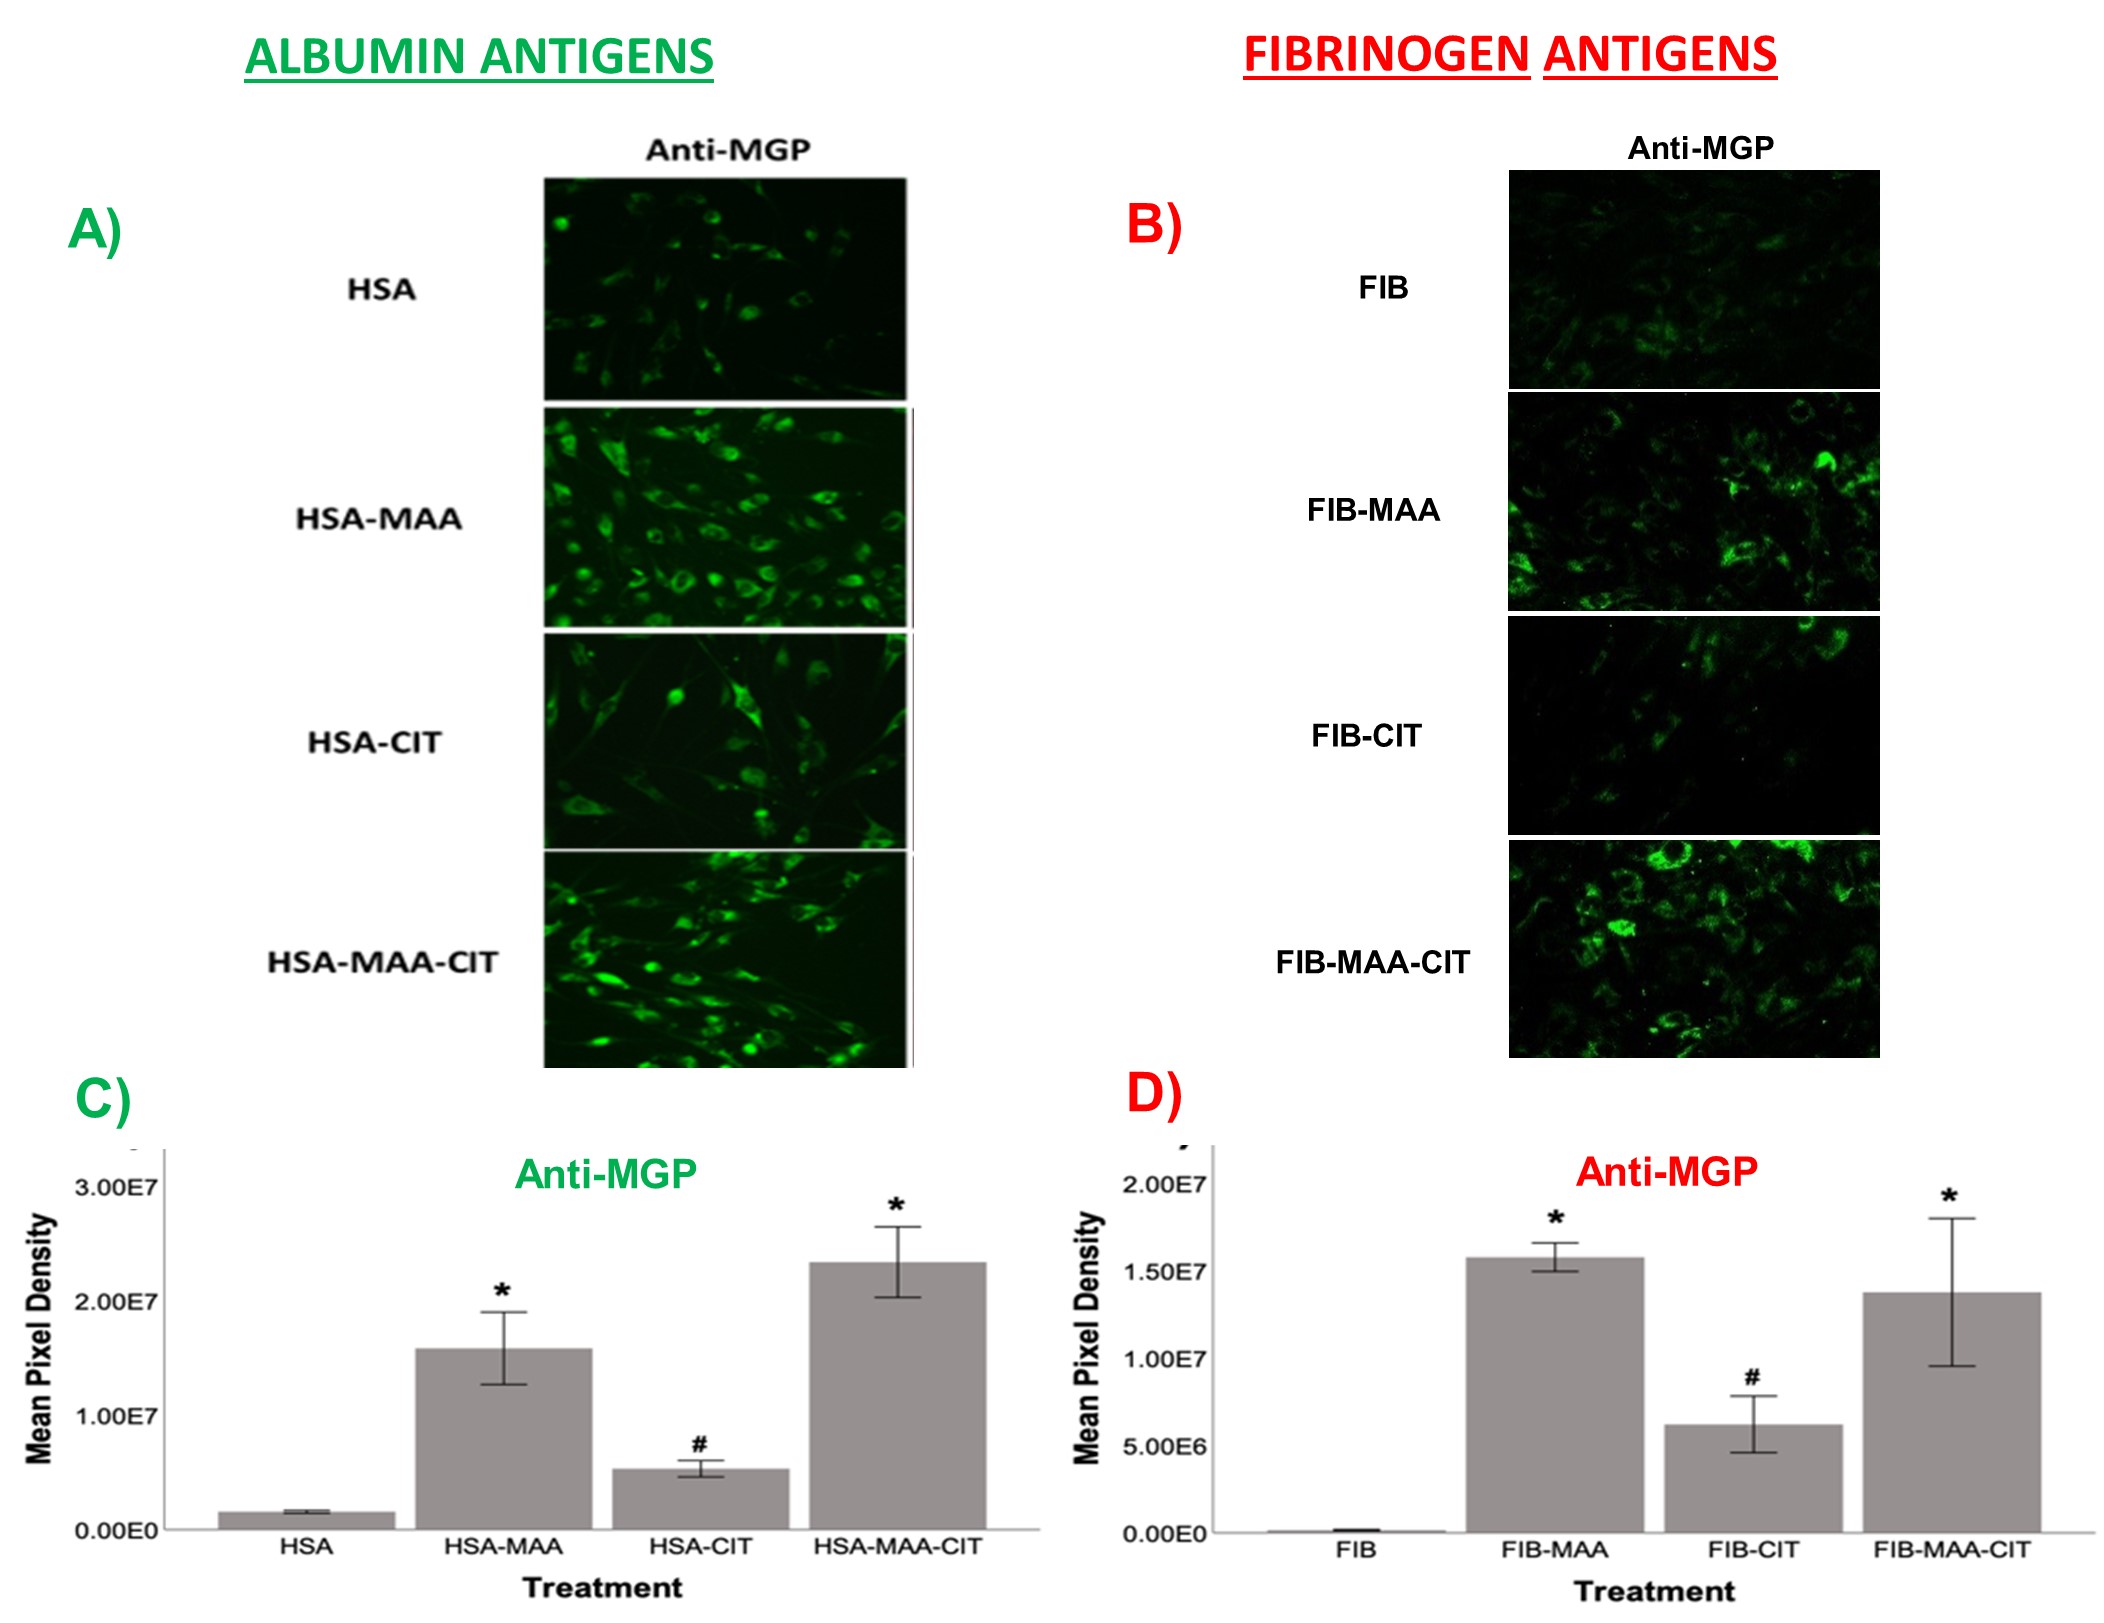 Figure 1. Fluorescent IHC for MGP expression in antigen stimulated HFLS-RA cells. HFLS-RA cells were stimulated with: A) modified HSA and B) modified FIB antigens. The data was quantified for MGP expression as Mean Pixel Density for C) modified HSA and D) modified FIB antigens. Comparisons were made to unmodified HSA or FIB, respectively: *p < 0.001, #p < 0.05, n=4.
 Figure 2. PCR for mRNA levels of calcium signaling proteins from stimulated HFLS-RA cells. HFLS-RA cells were stimulated with either MGP or MGP-MAA and the following calcium binding proteins were measured: CABIN1, ORAI1 and NFATc1. The data is represented as mean (standard deviation) of relative quantity (Rq) of proteins. All the values are compared to unmodified MGP: *p < 0.001, #p < 0.05, n=4. Calcium signaling proteins: CABIN1 (calcineurin binding protein 1), ORAI1 (ORAI Calcium Release-Activated Calcium Modulator 1), NFATc1 (Nuclear Factor of Activated T cells 1).
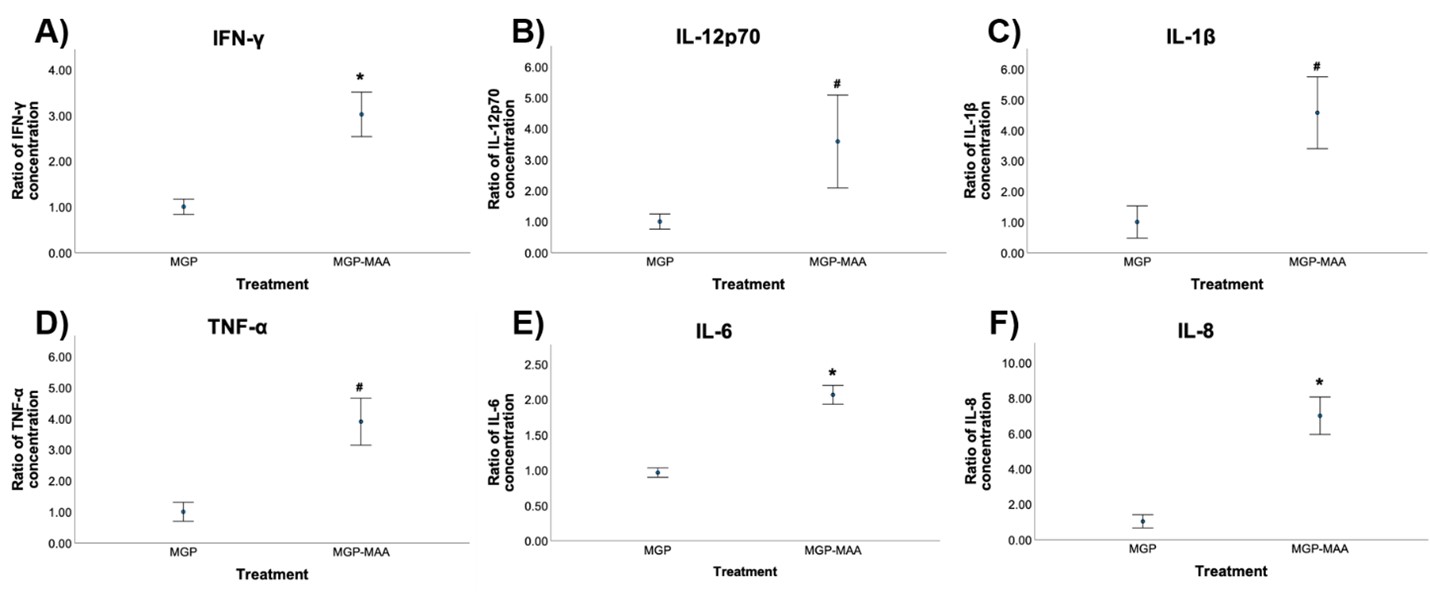 Figure 3. ELISA data for pro-inflammatory cytokines released from stimulated HFLS-RA cells. HFLS-RA cells were stimulated with either MGP or MGP-MAA and the following cytokines were measured: A) IFN-γ, B) IL-12p70, C) IL-1β, D) TNF-α, E) IL-6, and F) IL-8. All the values are compared to native protein. Comparisons made to unmodified MGP: *p < 0.001, #p < 0.05, n=4.