
Poster Session C
Imaging
.png "Nicola Dalbeth, MD photo")
Nicola Dalbeth, MD
University of Auckland
Auckland, New Zealand
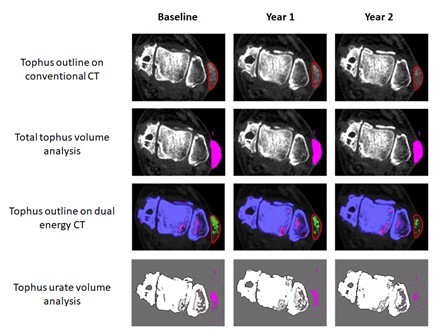 Figure 1. Example of an individual tophus measurement and change in the tophus composition over time
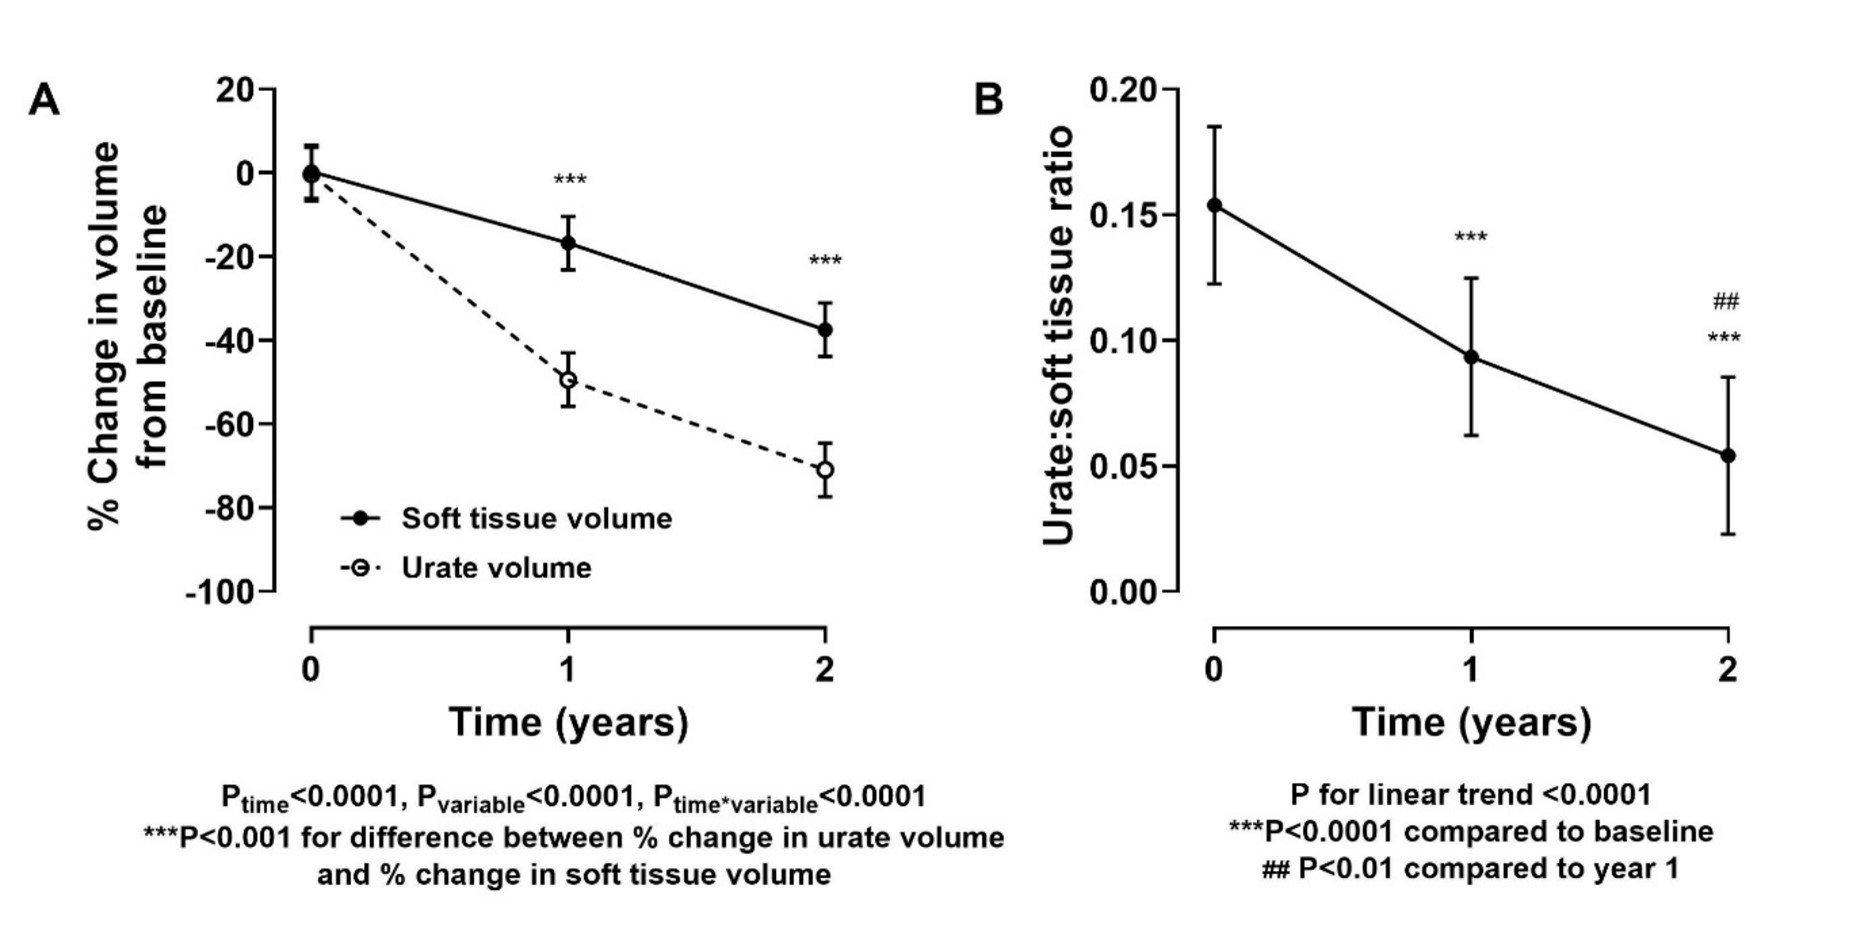 Figure 2. Comparison of change in urate and soft tissue volumes within all analyzed tophi. A. Percentage change from baseline in urate volume and soft tissue volume; B. Urate volume: soft tissue volume ratio over time. Data are presented as mean (95% CI).