
Poster Session B
Systemic lupus erythematosus (SLE)
Suzanne Shoffner-Beck, BS
University of Michigan
Ann Arbor, MI, United States
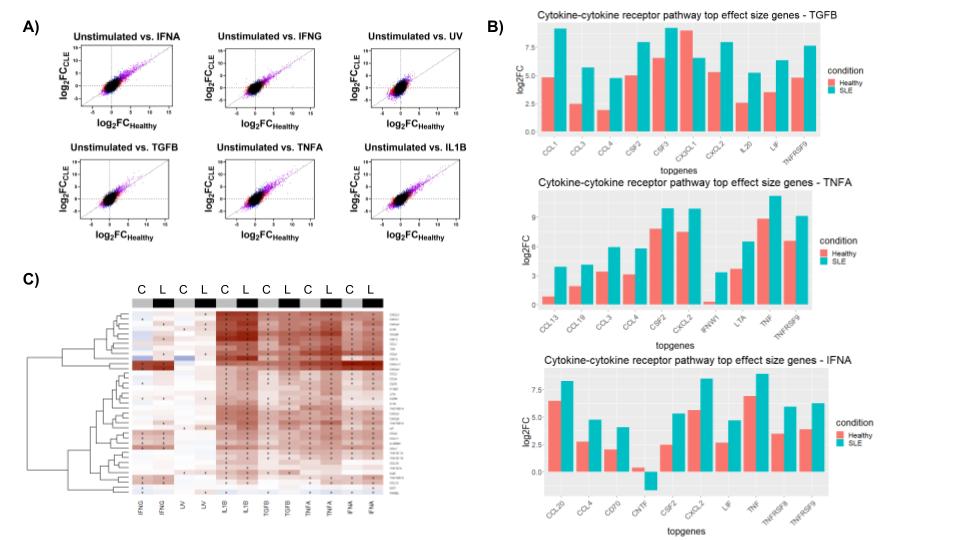 Figure 1: A) The effect sizes (log2FC) under indicated cytokine stimulations in healthy (x-axis) and lupus (y-axis) fibroblasts. Diagonal lines represent what would be expected if there is no difference in gene expression between SLE and healthy conditions. B) Bar plots highlighting the differential gene expression for genes in pathways of interest. C) Heatmap illustrating the relatively higher upregulation of cytokine-cytokine receptor pathway genes in lupus compared to healthy controls.
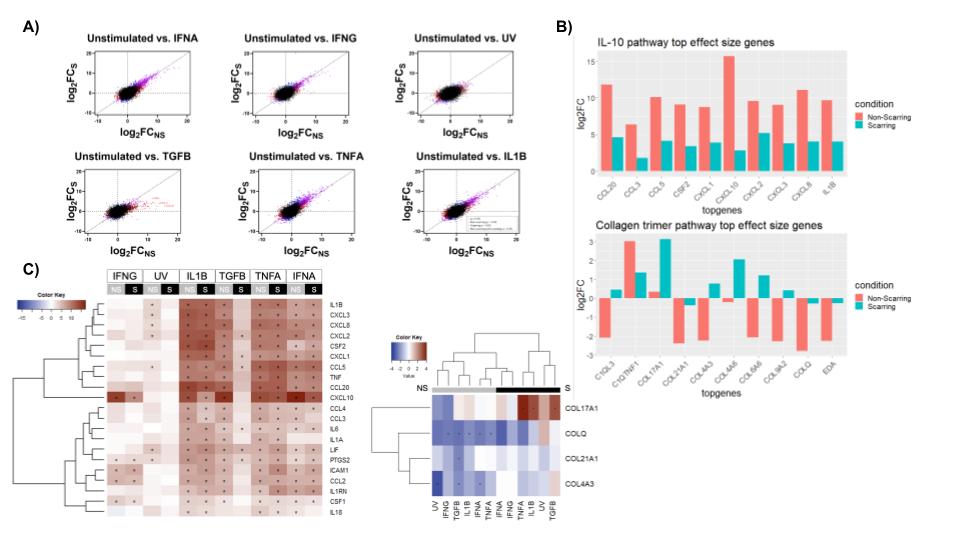 Figure 2: A) The effect sizes (log2FC) under indicated cytokine stimulations in non-scarring (x-axis) and scarring (y-axis) lupus fibroblasts. Diagonal lines represent what would be expected if there is no difference in gene expression between scarring and non-scarring conditions. B) Bar plots highlighting the differential gene expression for genes in pathways of interest. C & D) Heatmaps illustrating the relatively higher upregulation of IL-10 pathway genes in non-scarring disease compared to scarring disease and the upregulation of collagen trimer pathway genes in scarring disease compared with non-scarring.