
Poster Session B
Systemic lupus erythematosus (SLE)
Felix Chin, BS
University of Pennsylvania Perelman School of Medicine
Philadelphia, PA, United States
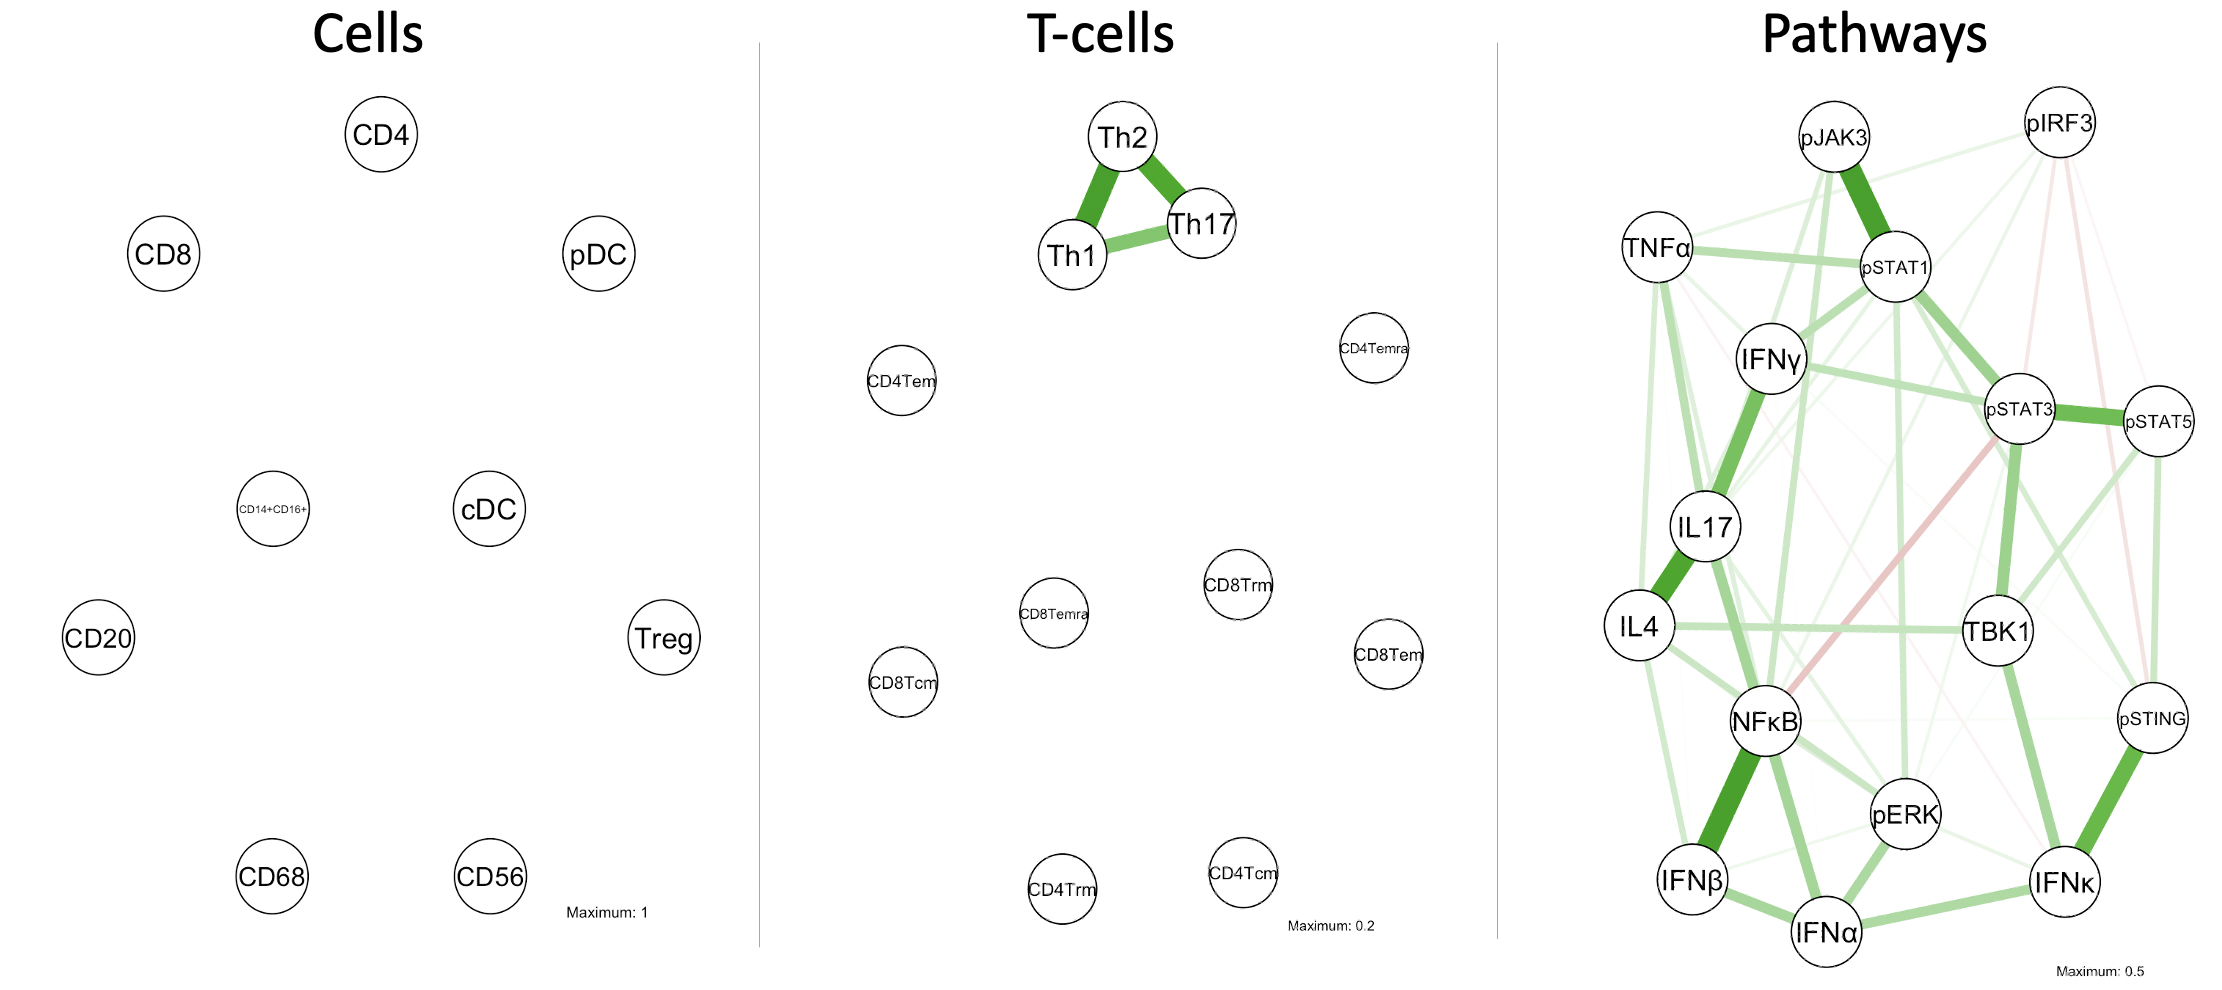 Fig 1. GGM networks of cells, T-cell subsets and pathway proteins. Lines indicate significant correlations between nodes. Green lines indicate positive association while red lines indicate a negative association. Line color intensity and spatial proximity between nodes is a reflection of correlation strength.
 .jpeg) Table 1. Spearman's R correlation coefficient strengths between all possible pairs of cells or cytokines involved in Th1, Th2 and Th17 response.
Table 1. Spearman's R correlation coefficient strengths between all possible pairs of cells or cytokines involved in Th1, Th2 and Th17 response. .jpeg) Fig 2. Linear relationship between IL4 and IL17 levels across 44 patients studied.
Fig 2. Linear relationship between IL4 and IL17 levels across 44 patients studied.