
Poster Session B
Systemic lupus erythematosus (SLE)
Emily Vara, DO
Medical University of South Carolina
Charleston, SC, United States
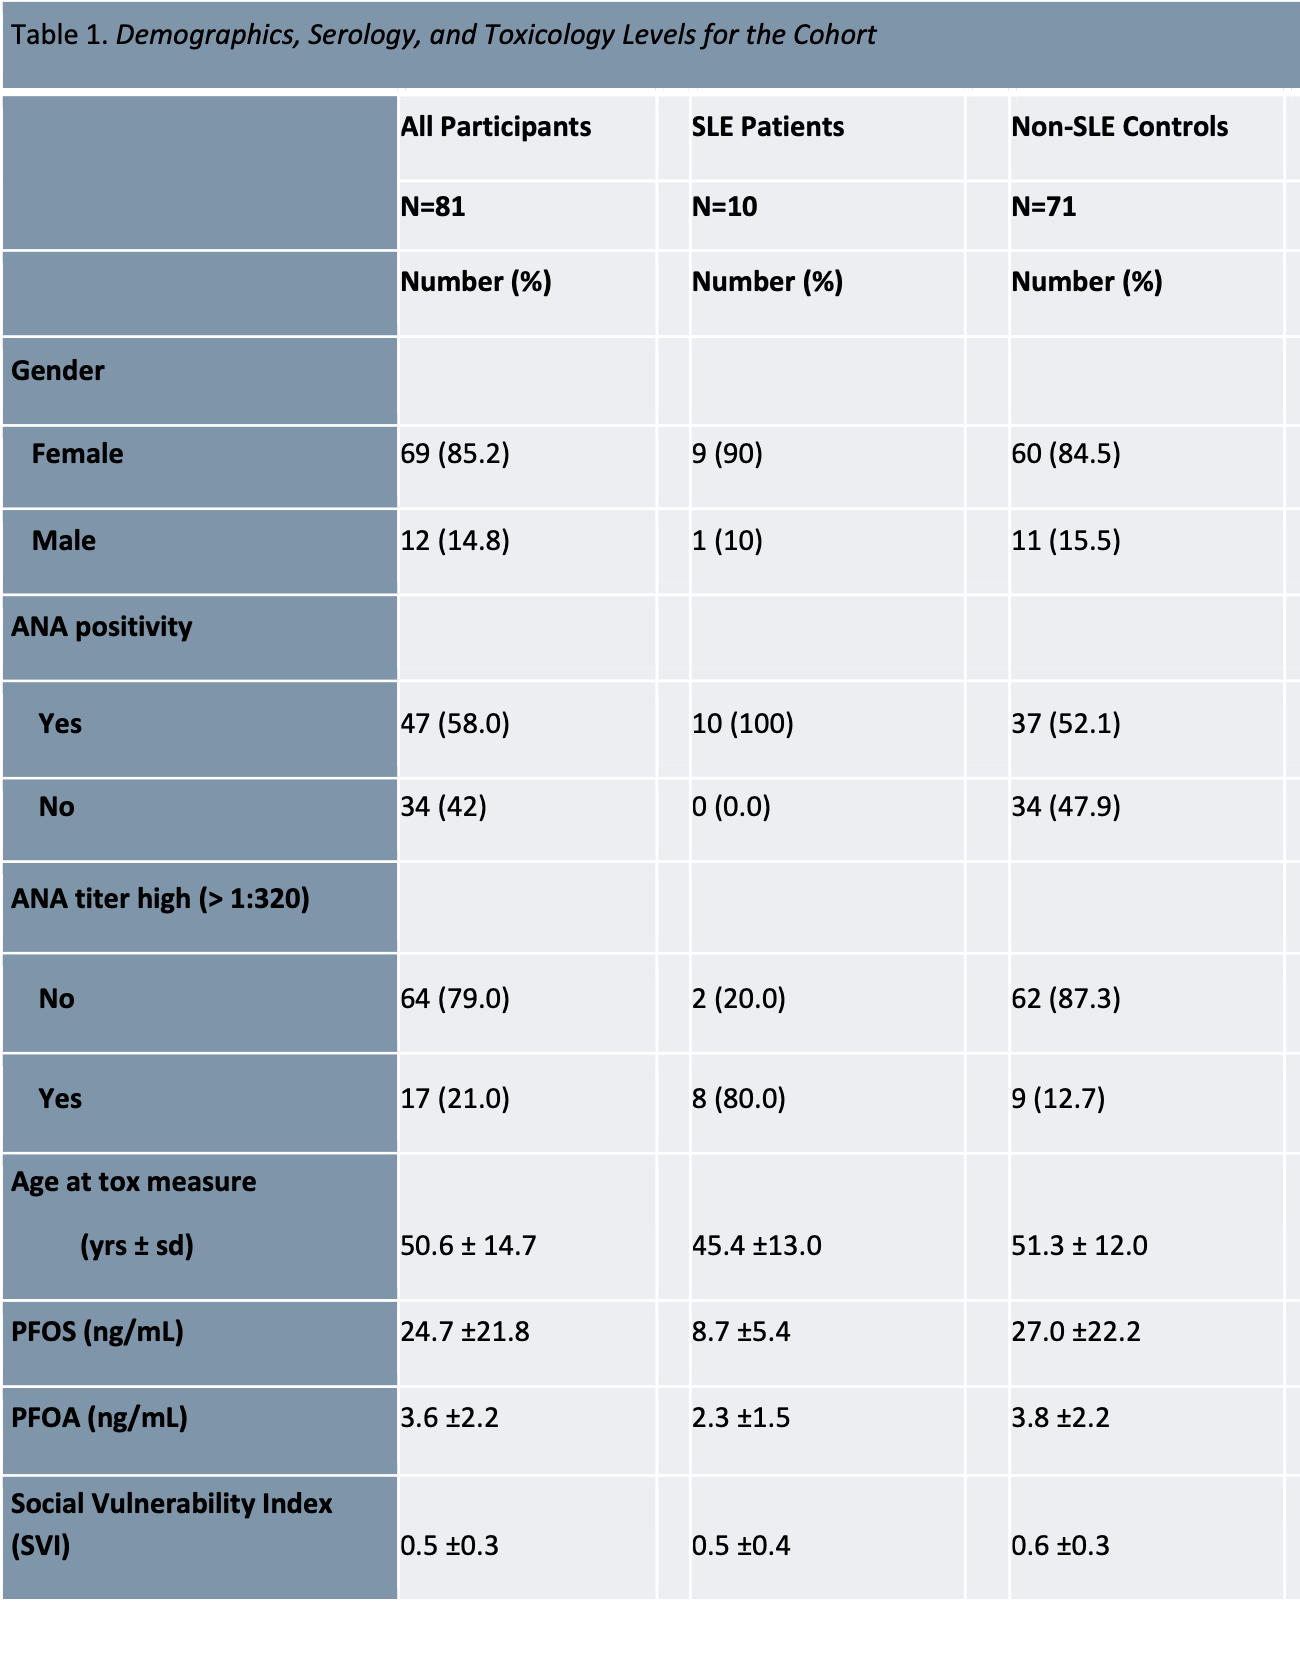 Table 1. Demographics, serology, and toxiciology levels of participants.
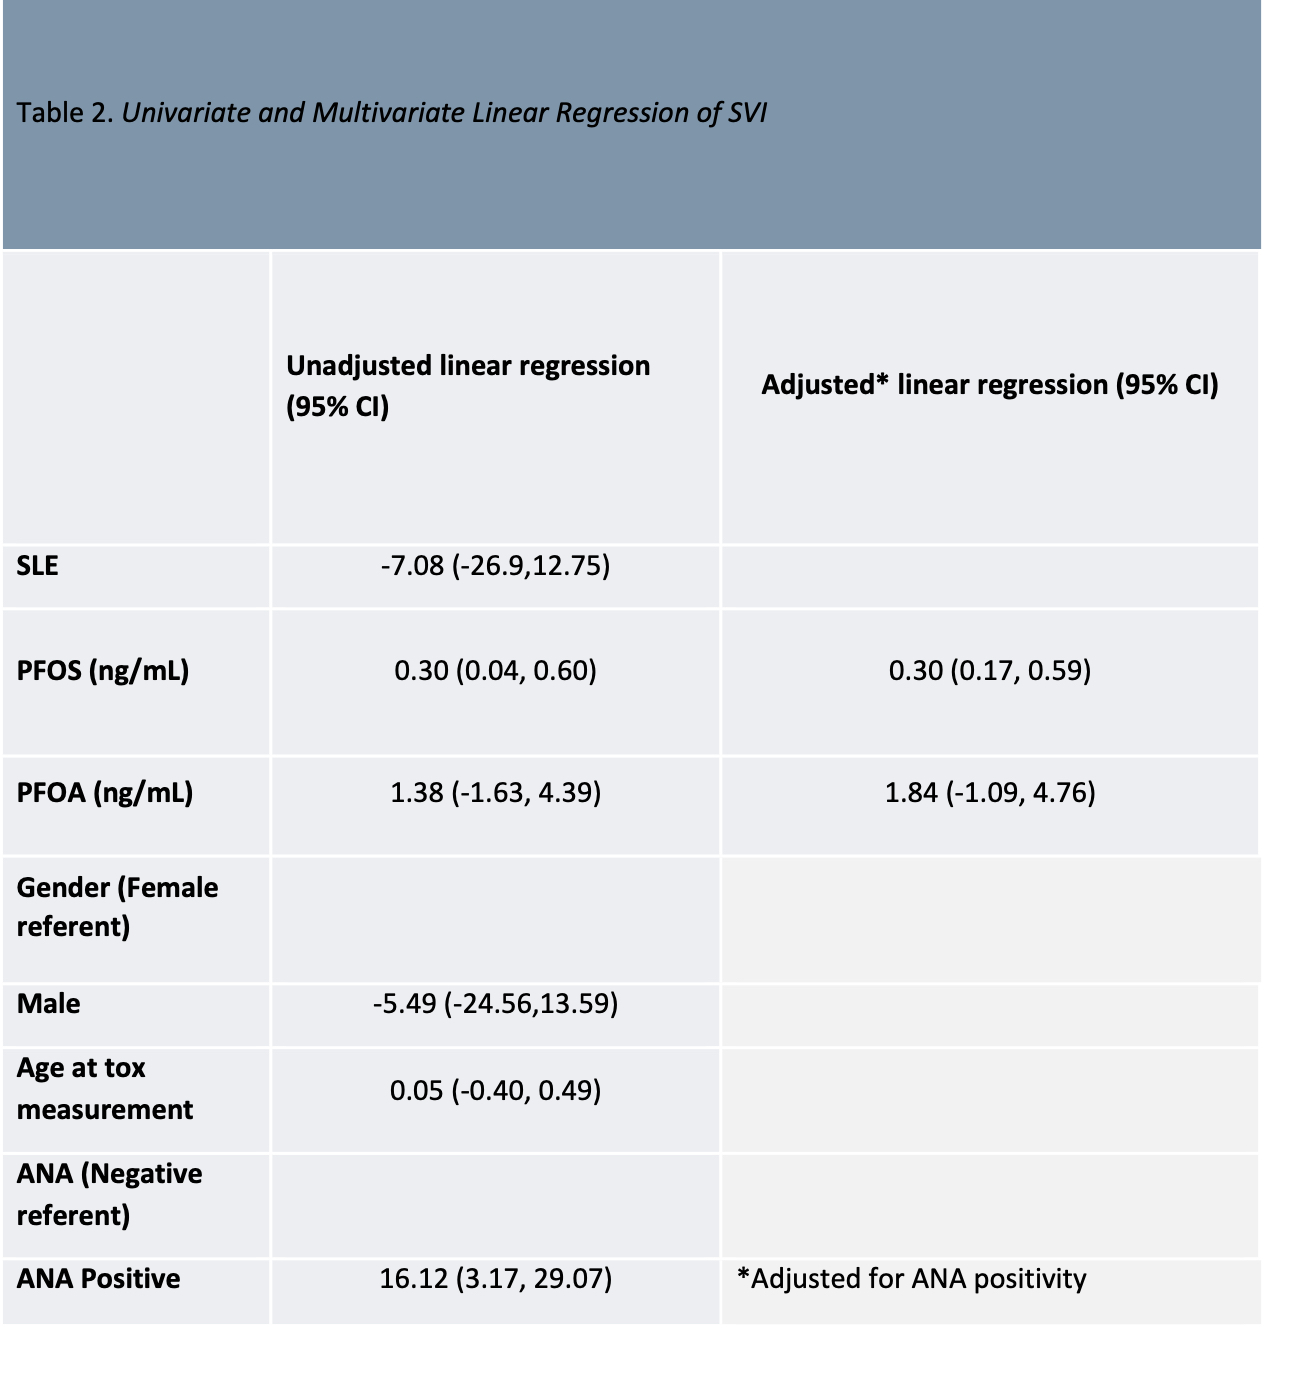 Table 2. Univariate and multivariate linear regression analysis.
.jpg) Figure 1. Box and whisker plots showing (a) PFOS by gender and ANA positivity for controls, (b) PFOA by gender and ANA positivity for controls, and (c) SVI by gender and ANA positivity for controls.
Figure 1. Box and whisker plots showing (a) PFOS by gender and ANA positivity for controls, (b) PFOA by gender and ANA positivity for controls, and (c) SVI by gender and ANA positivity for controls.