
Poster Session B
Systemic lupus erythematosus (SLE)
Alessandra Ida Celia, MD
Johns Hopkins University
Baltimore, MD, United States
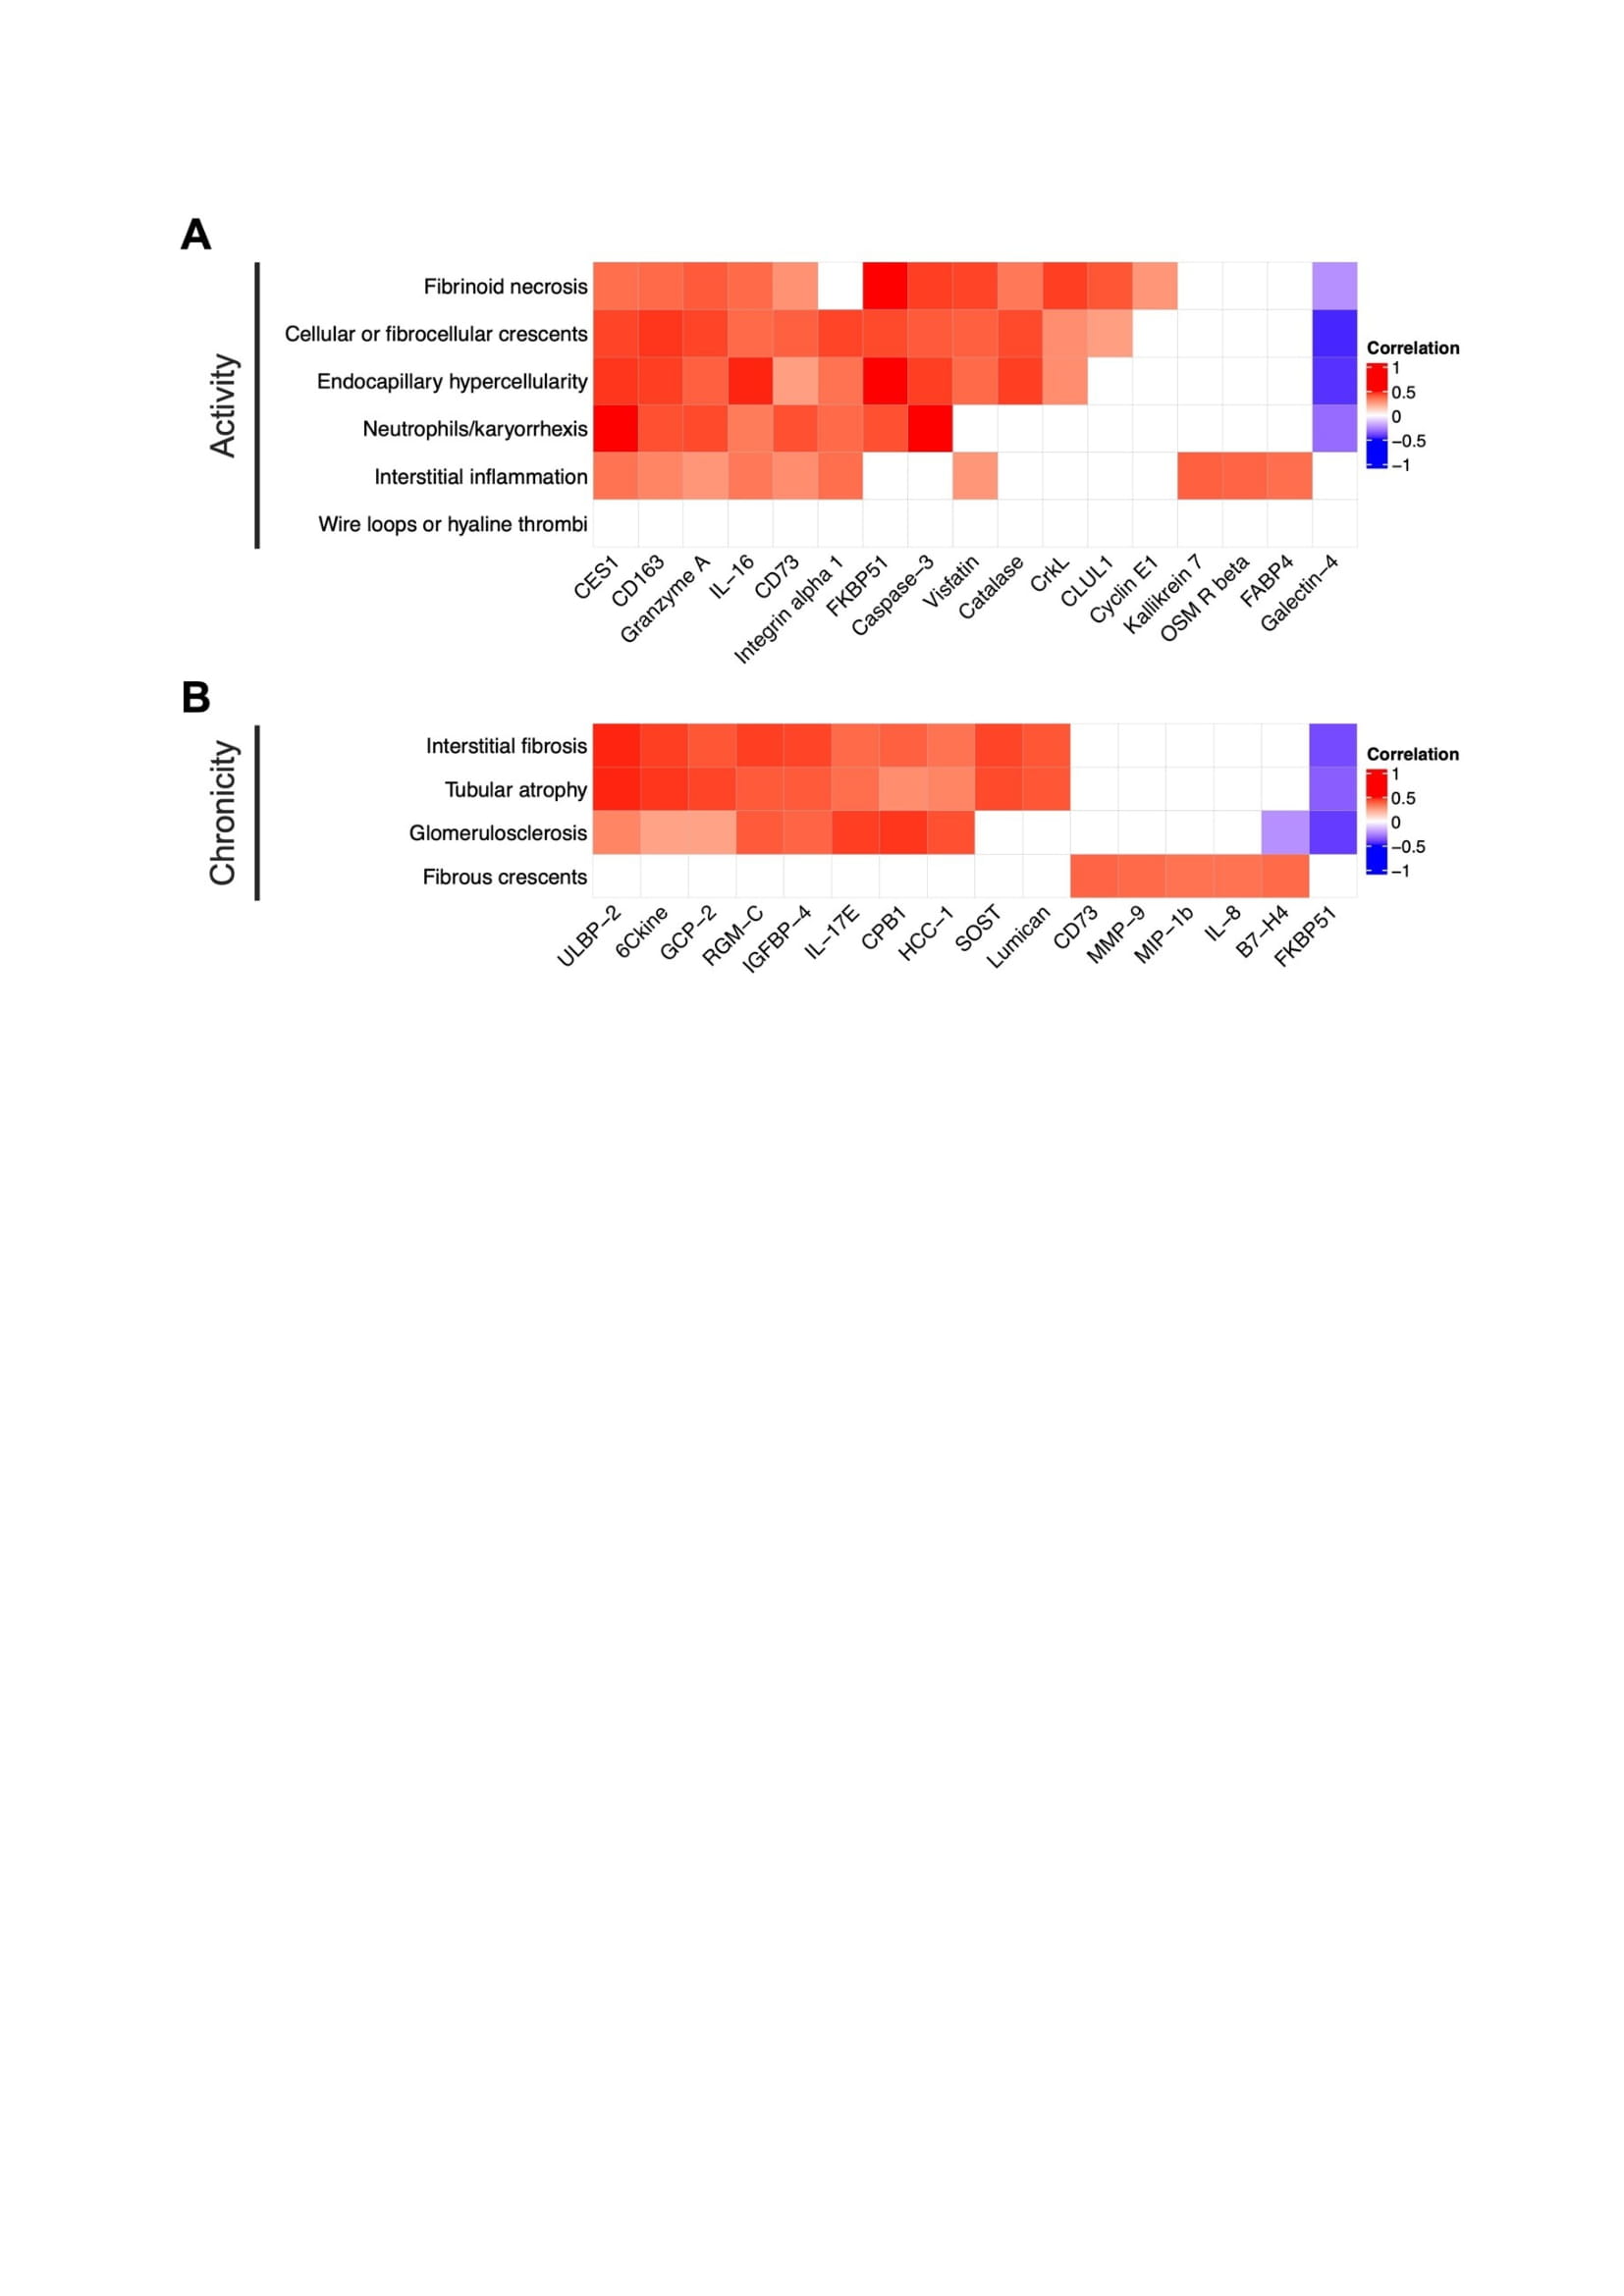 Figure 1. Proteomic signatures of LN histological lesions. Heatmap displaying Spearman correlations of urinary proteins and any single subitem of the NIH activity (A) and chronicity (B) indices. For each lesion, the 5 most correlated proteins are displayed. Empty squares indicate a false discovery (FDR) rate > 0.25.
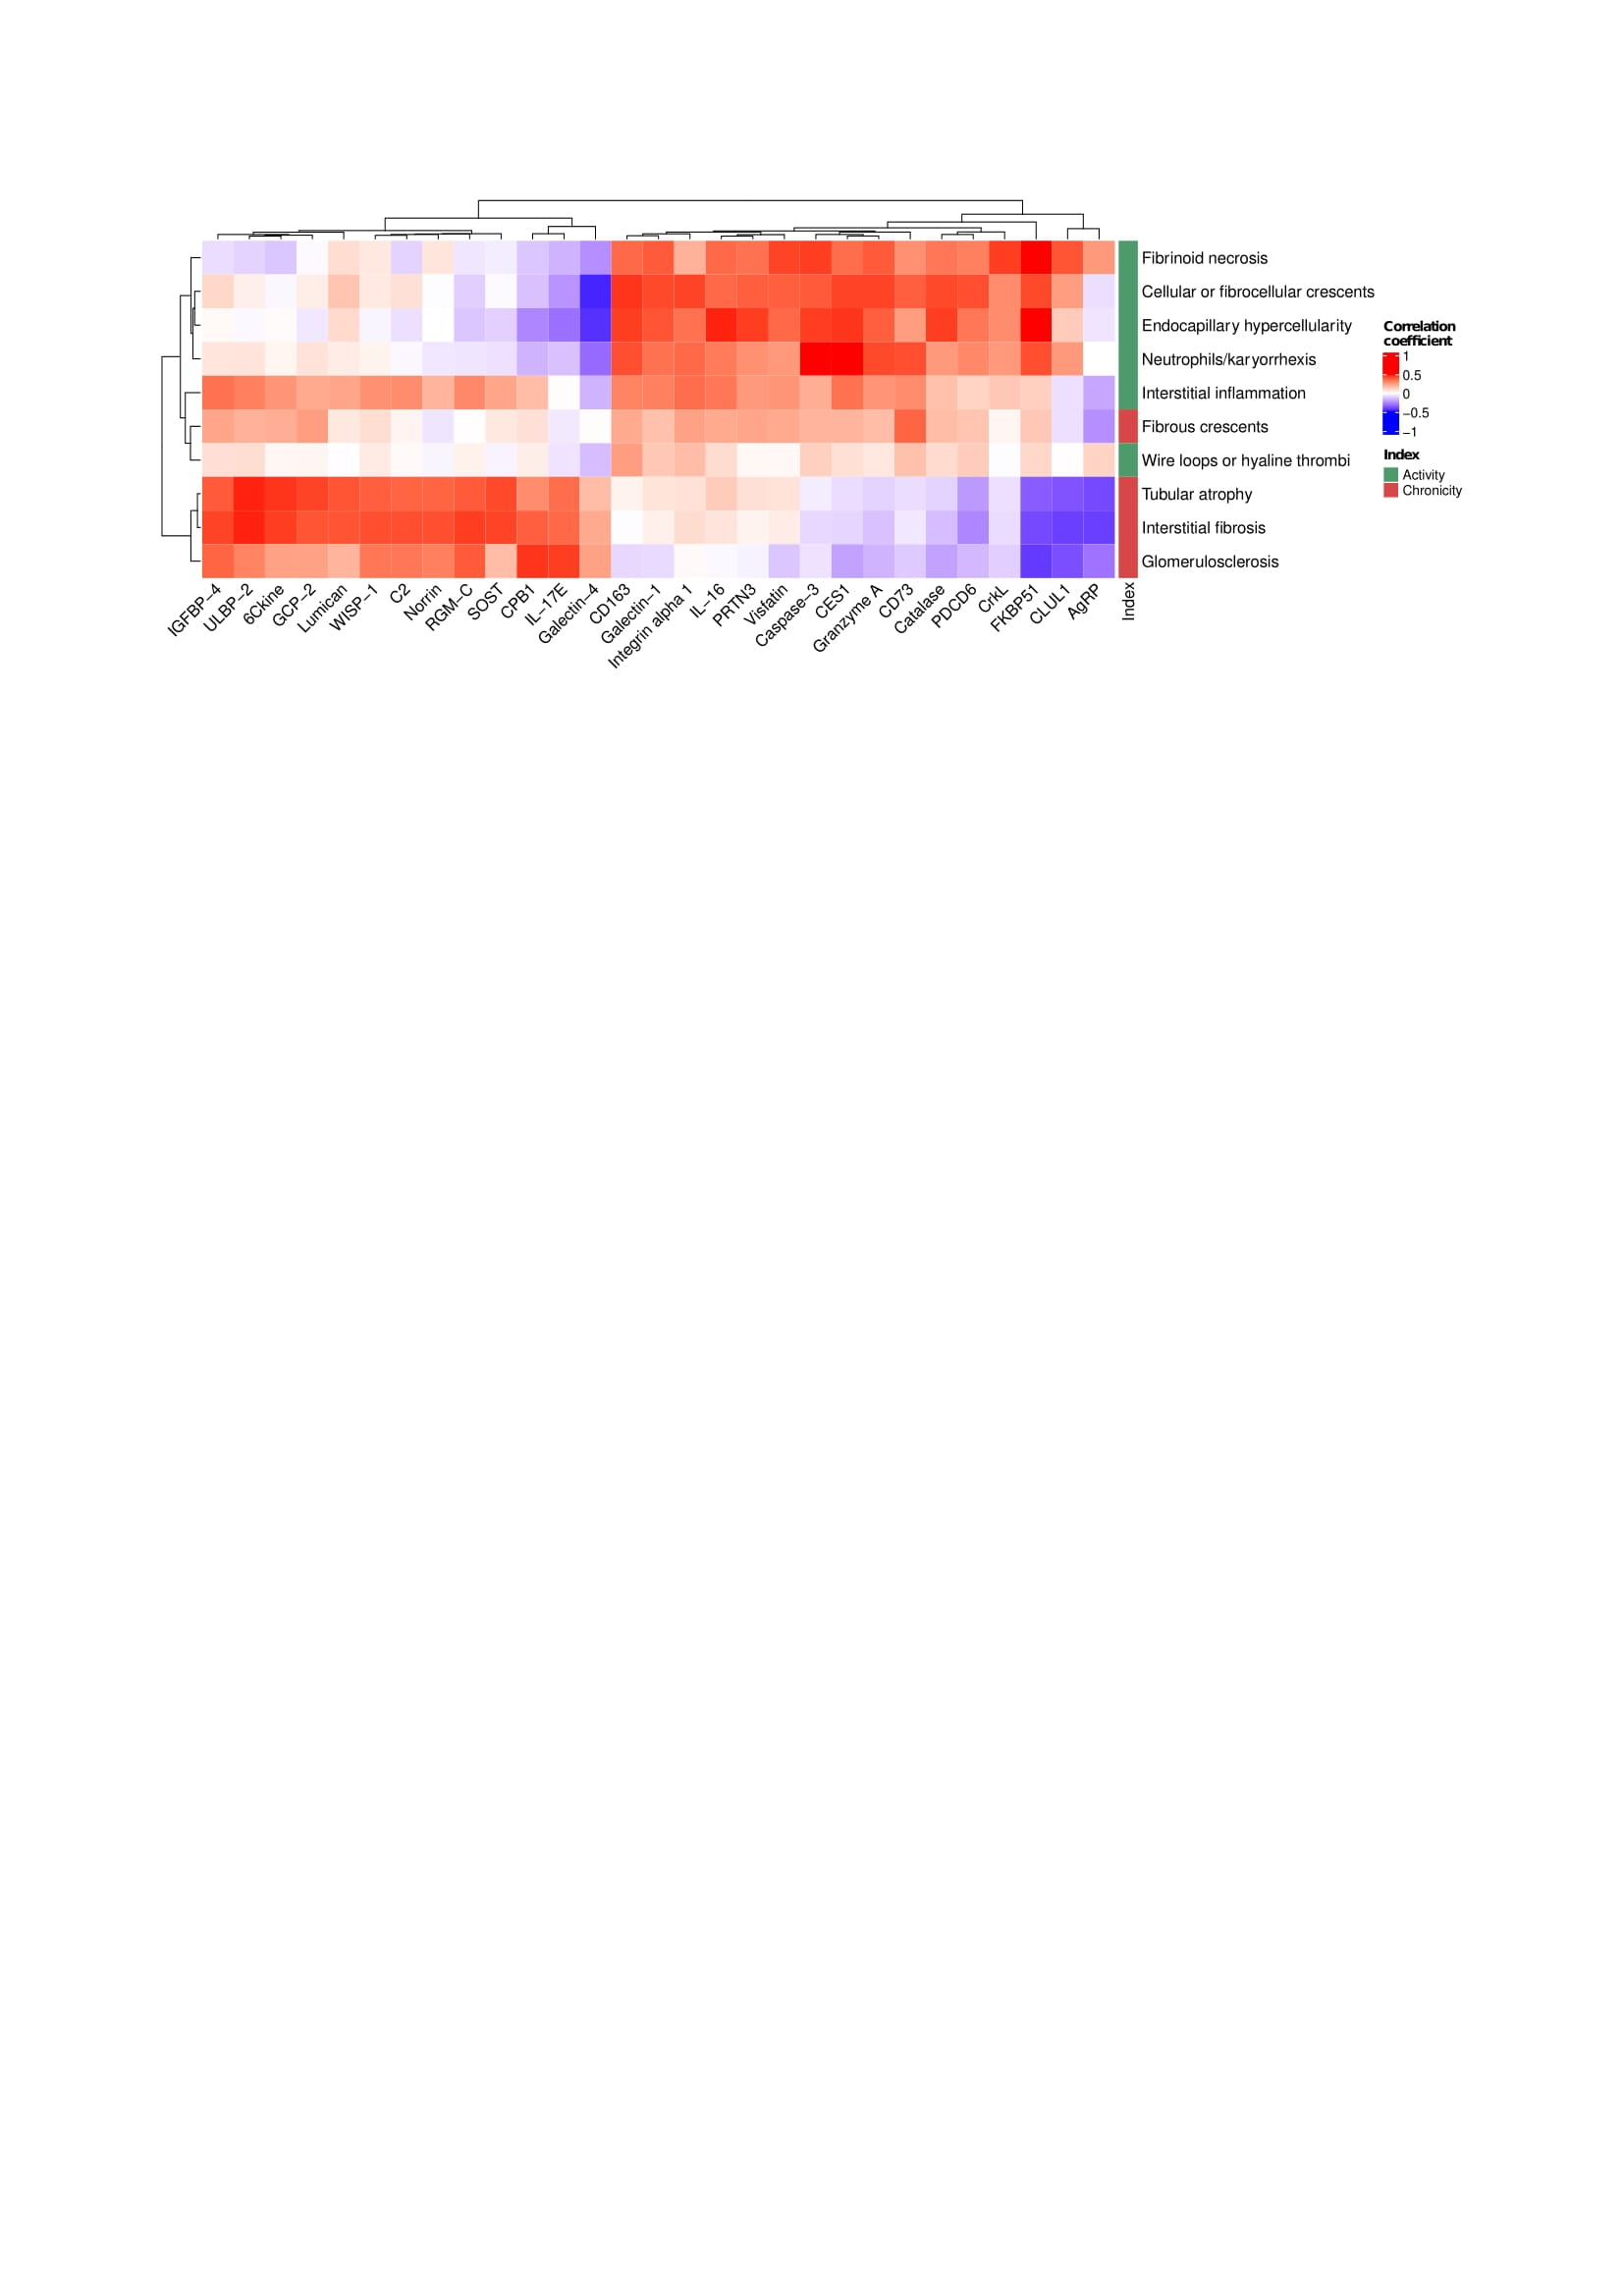 Figure 2. Fibrous crescents cluster with LN activity lesions. Hierarchical clustering based on the correlations of each histological lesion and urinary proteins. All proteins with a strict statistically significant correlation (FDR < 0.01) with at least one histological lesion were included.