
Poster Session B
Spondyloarthritis (SpA) including psoriatic arthritis (PsA)
Sali Merjanah, MD
Boston University
Boston, MA, United States
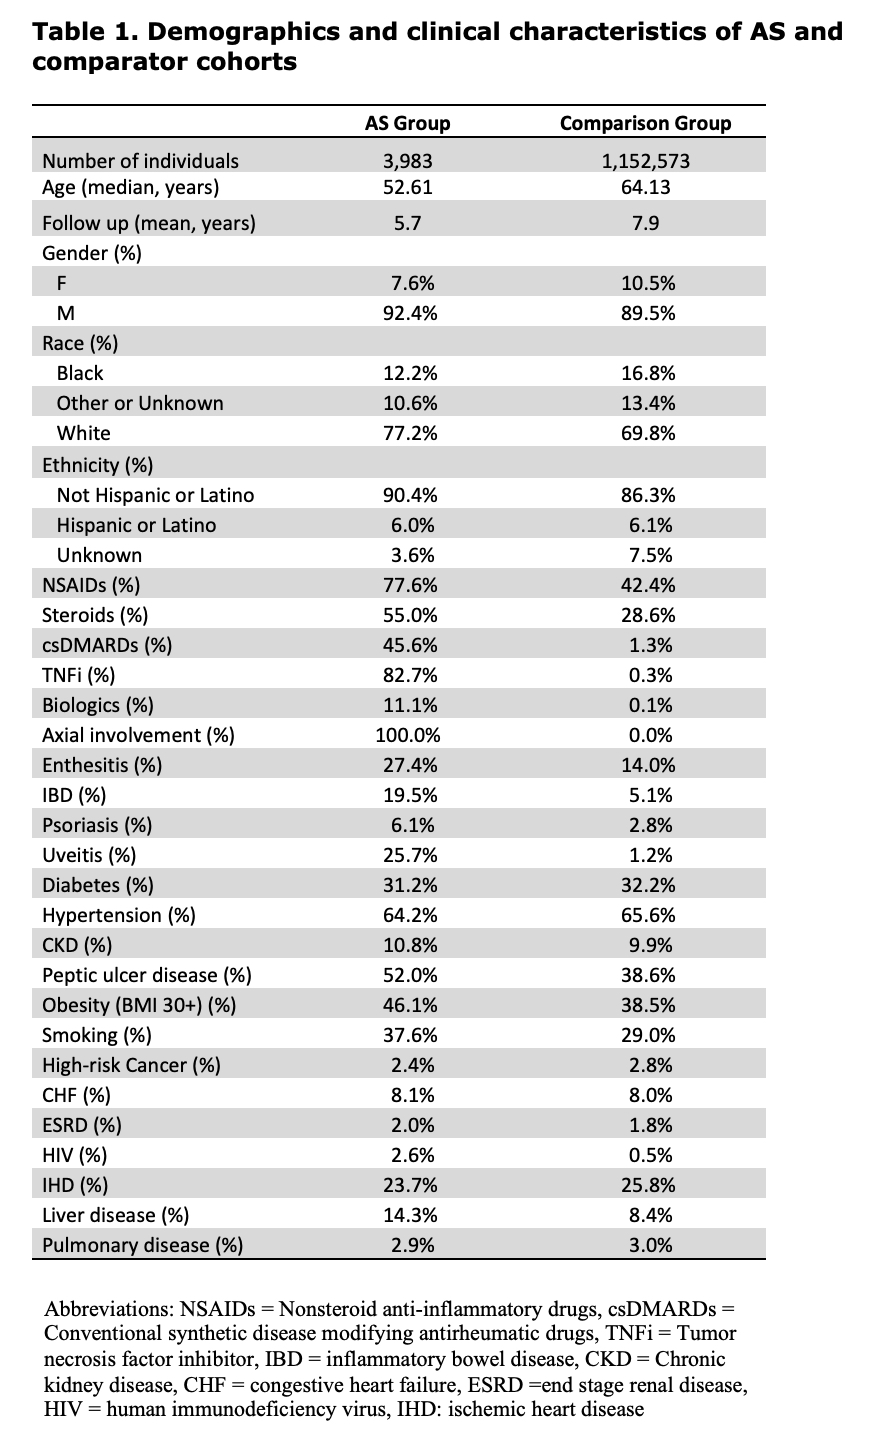 Table 1. Demographics and clinical characteristics of AS and comparator cohorts
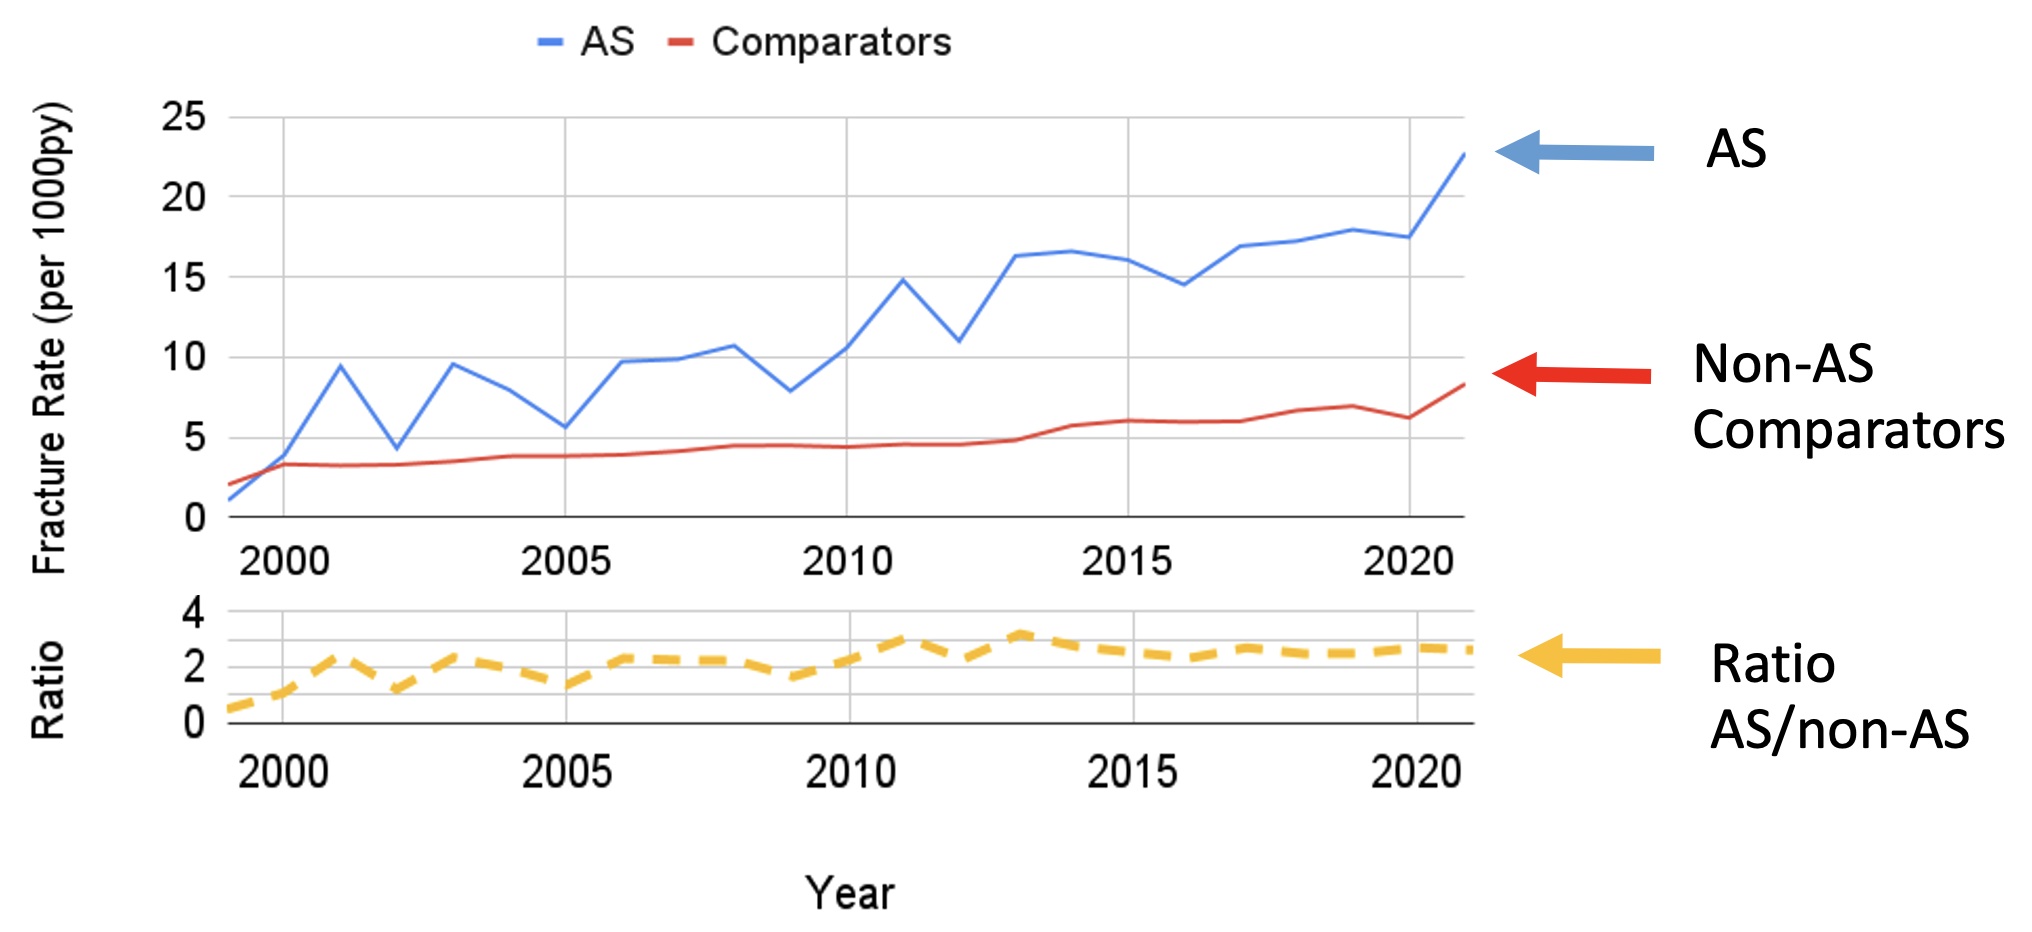 Figure 1. Fracture rates for AS, comparators and the Ratio (AS/Comparator)
.jpg) Figure 2. Fracture rate per 1000 PY among those with AS. Each dot represents the fracture rate in a 6-month period. The trend in fracture rates fit from observed data is shown as a solid line. The pre-TNFi period (2000-2003) slope is extended as a dashed line to allow comparison of the baseline period slope with the observed data slope in the TNFi period (2004-2021). Compared to the pre-TNFi era, the rate of fractures in the TNFi era is increased by 15 per 1000 PY.
Figure 2. Fracture rate per 1000 PY among those with AS. Each dot represents the fracture rate in a 6-month period. The trend in fracture rates fit from observed data is shown as a solid line. The pre-TNFi period (2000-2003) slope is extended as a dashed line to allow comparison of the baseline period slope with the observed data slope in the TNFi period (2004-2021). Compared to the pre-TNFi era, the rate of fractures in the TNFi era is increased by 15 per 1000 PY. 