
Abstract Session
Rheumatoid arthritis (RA)
Vincent Bouget, MSc
Scienta Lab
Paris, France
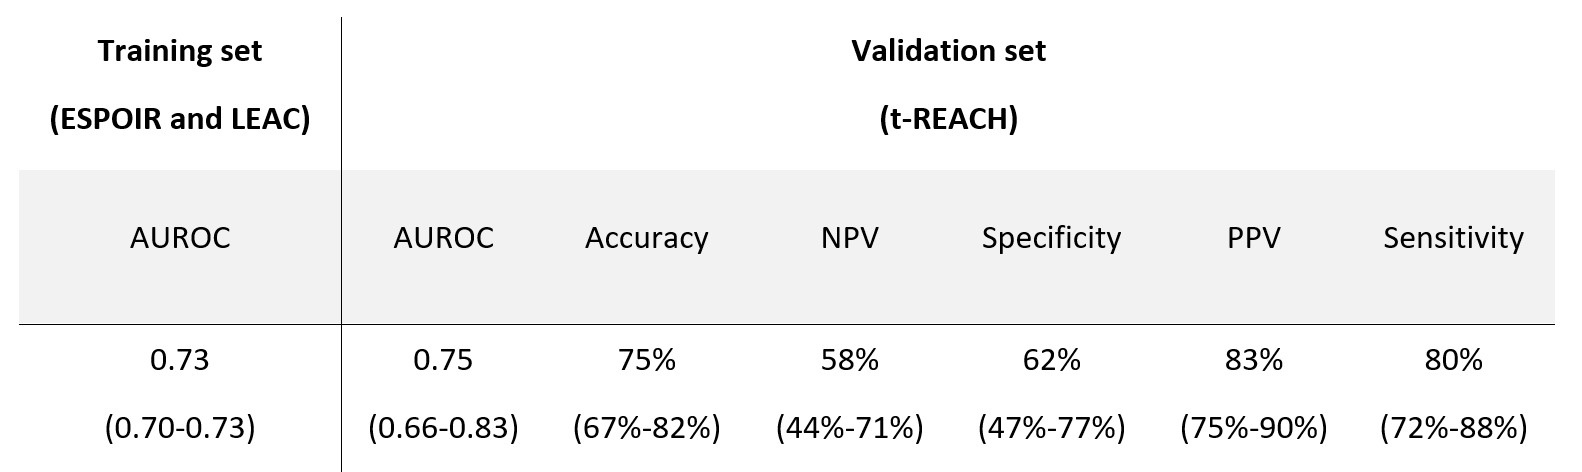 Table 1. Machine learning model performances.
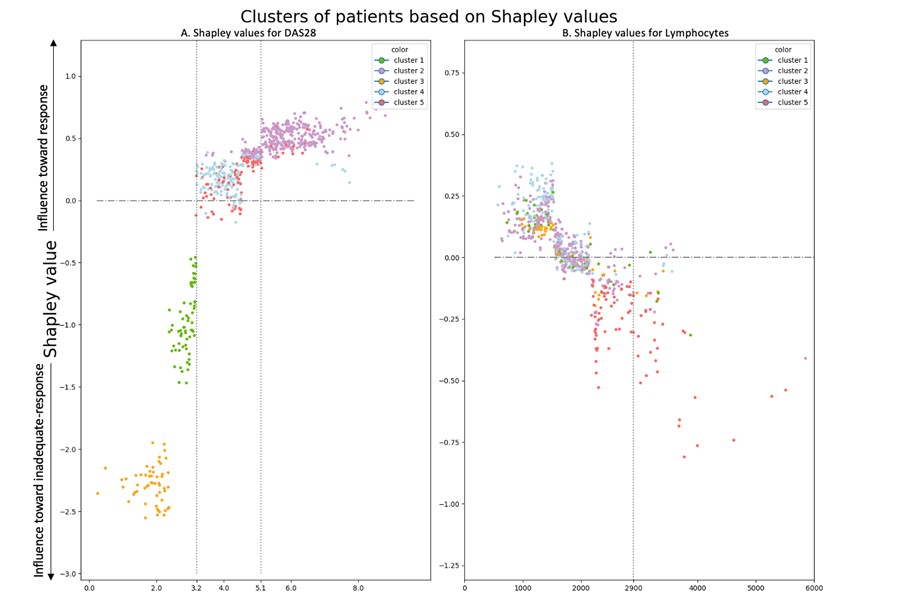 Figure 1. Shapley values graphs A positive Shapley value represents how much the variable influences the prediction towards response for a given patient. Each patient is represented by a point. Patients are clustered based on Shapley values.
 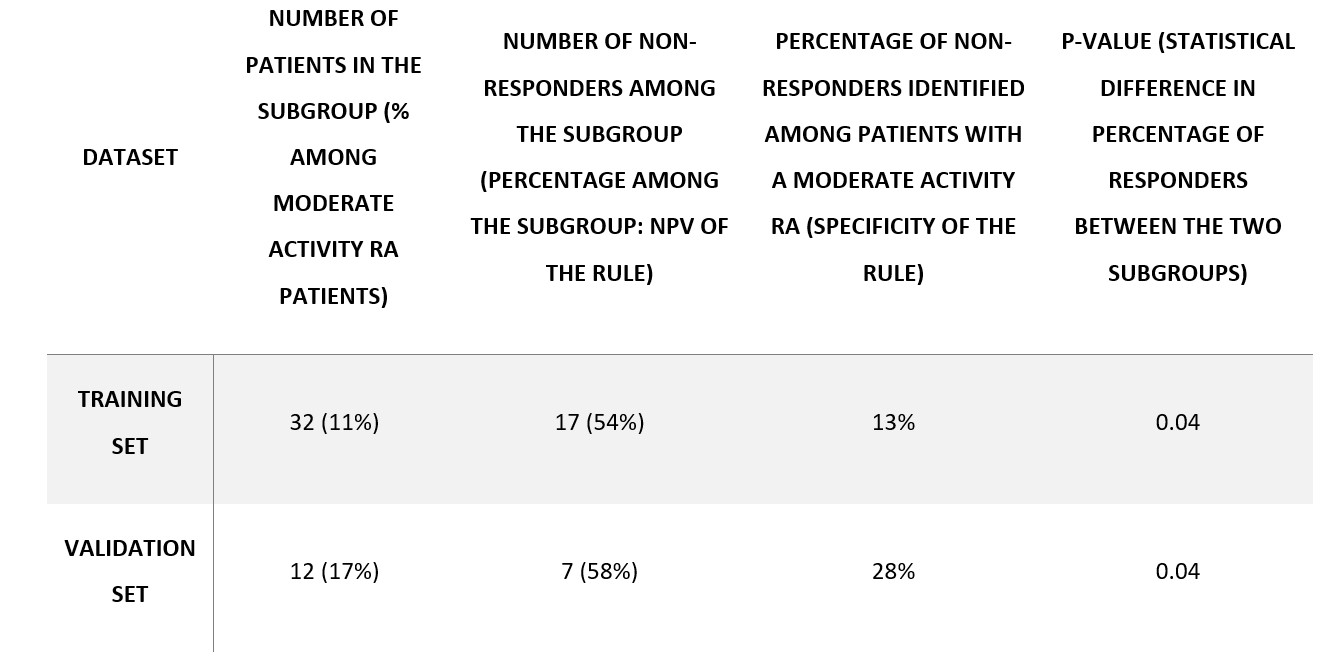 Table 2. Summary of high-lymphocytes-count subgroup statistics.