
Poster Session A
Vasculitis
Despoina Michailidou, MD
University of Washington
Seattle, WA, United States
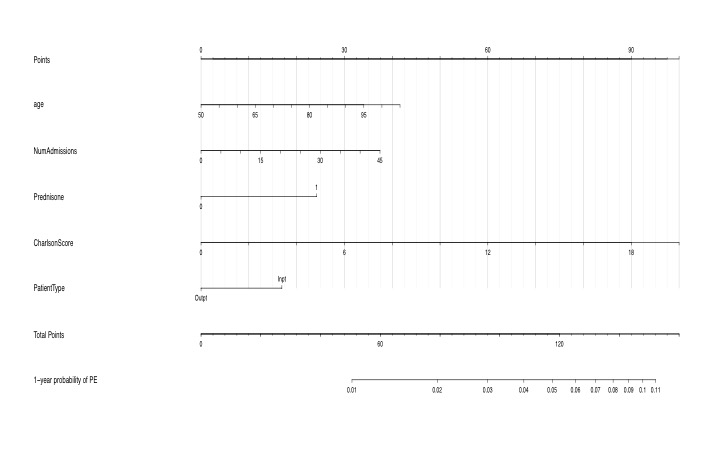 Figure 1. Nomogram for predicting the 1-year probability of PE in patients with GCA. NumAdmissions, number of admissions; Outpt, outpatient; Inpt, inpatient
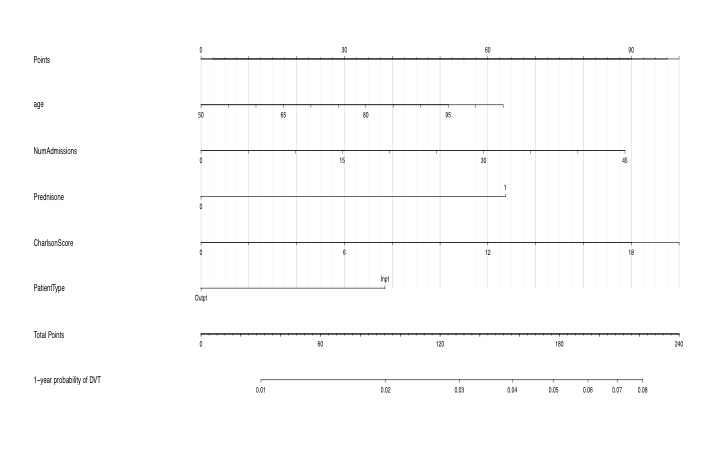 Figure 2. Nomogram for predicting the 1-year probability of DVT in patients with GCA. NumAdmissions, number of admissions; Outpt, outpatient; Inpt, inpatient
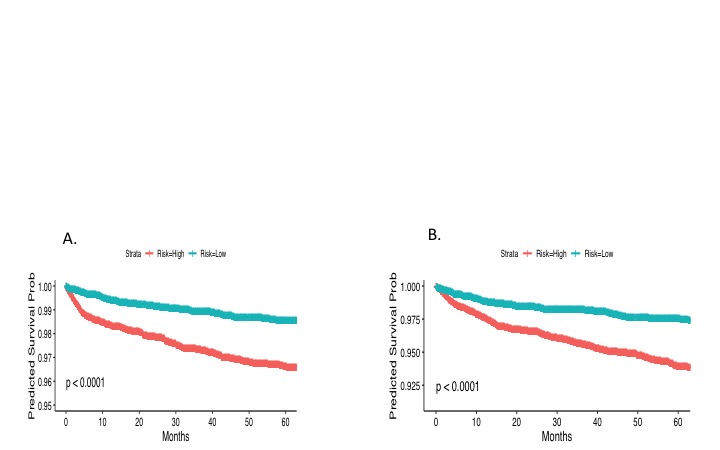 Figure 3. Kaplan-Meier plot for the time to PE (A) and DVT (B) from the time of diagnosis of GCA stratified by predicted risk (blue and red lines).