
Poster Session A
Systemic lupus erythematosus (SLE)
Shi-Nan Luong, MBBS
UNSW
Kensington, New South Wales, Australia
.jpg) Figure 1: Method chart outlining study groups, collection timepoints, data collected and statistical analysis methods used.
Figure 1: Method chart outlining study groups, collection timepoints, data collected and statistical analysis methods used. .jpg) Table 1: Demographic and clinical table comparing pregnant SLE and non-pregnant SLE cohorts.
Table 1: Demographic and clinical table comparing pregnant SLE and non-pregnant SLE cohorts. 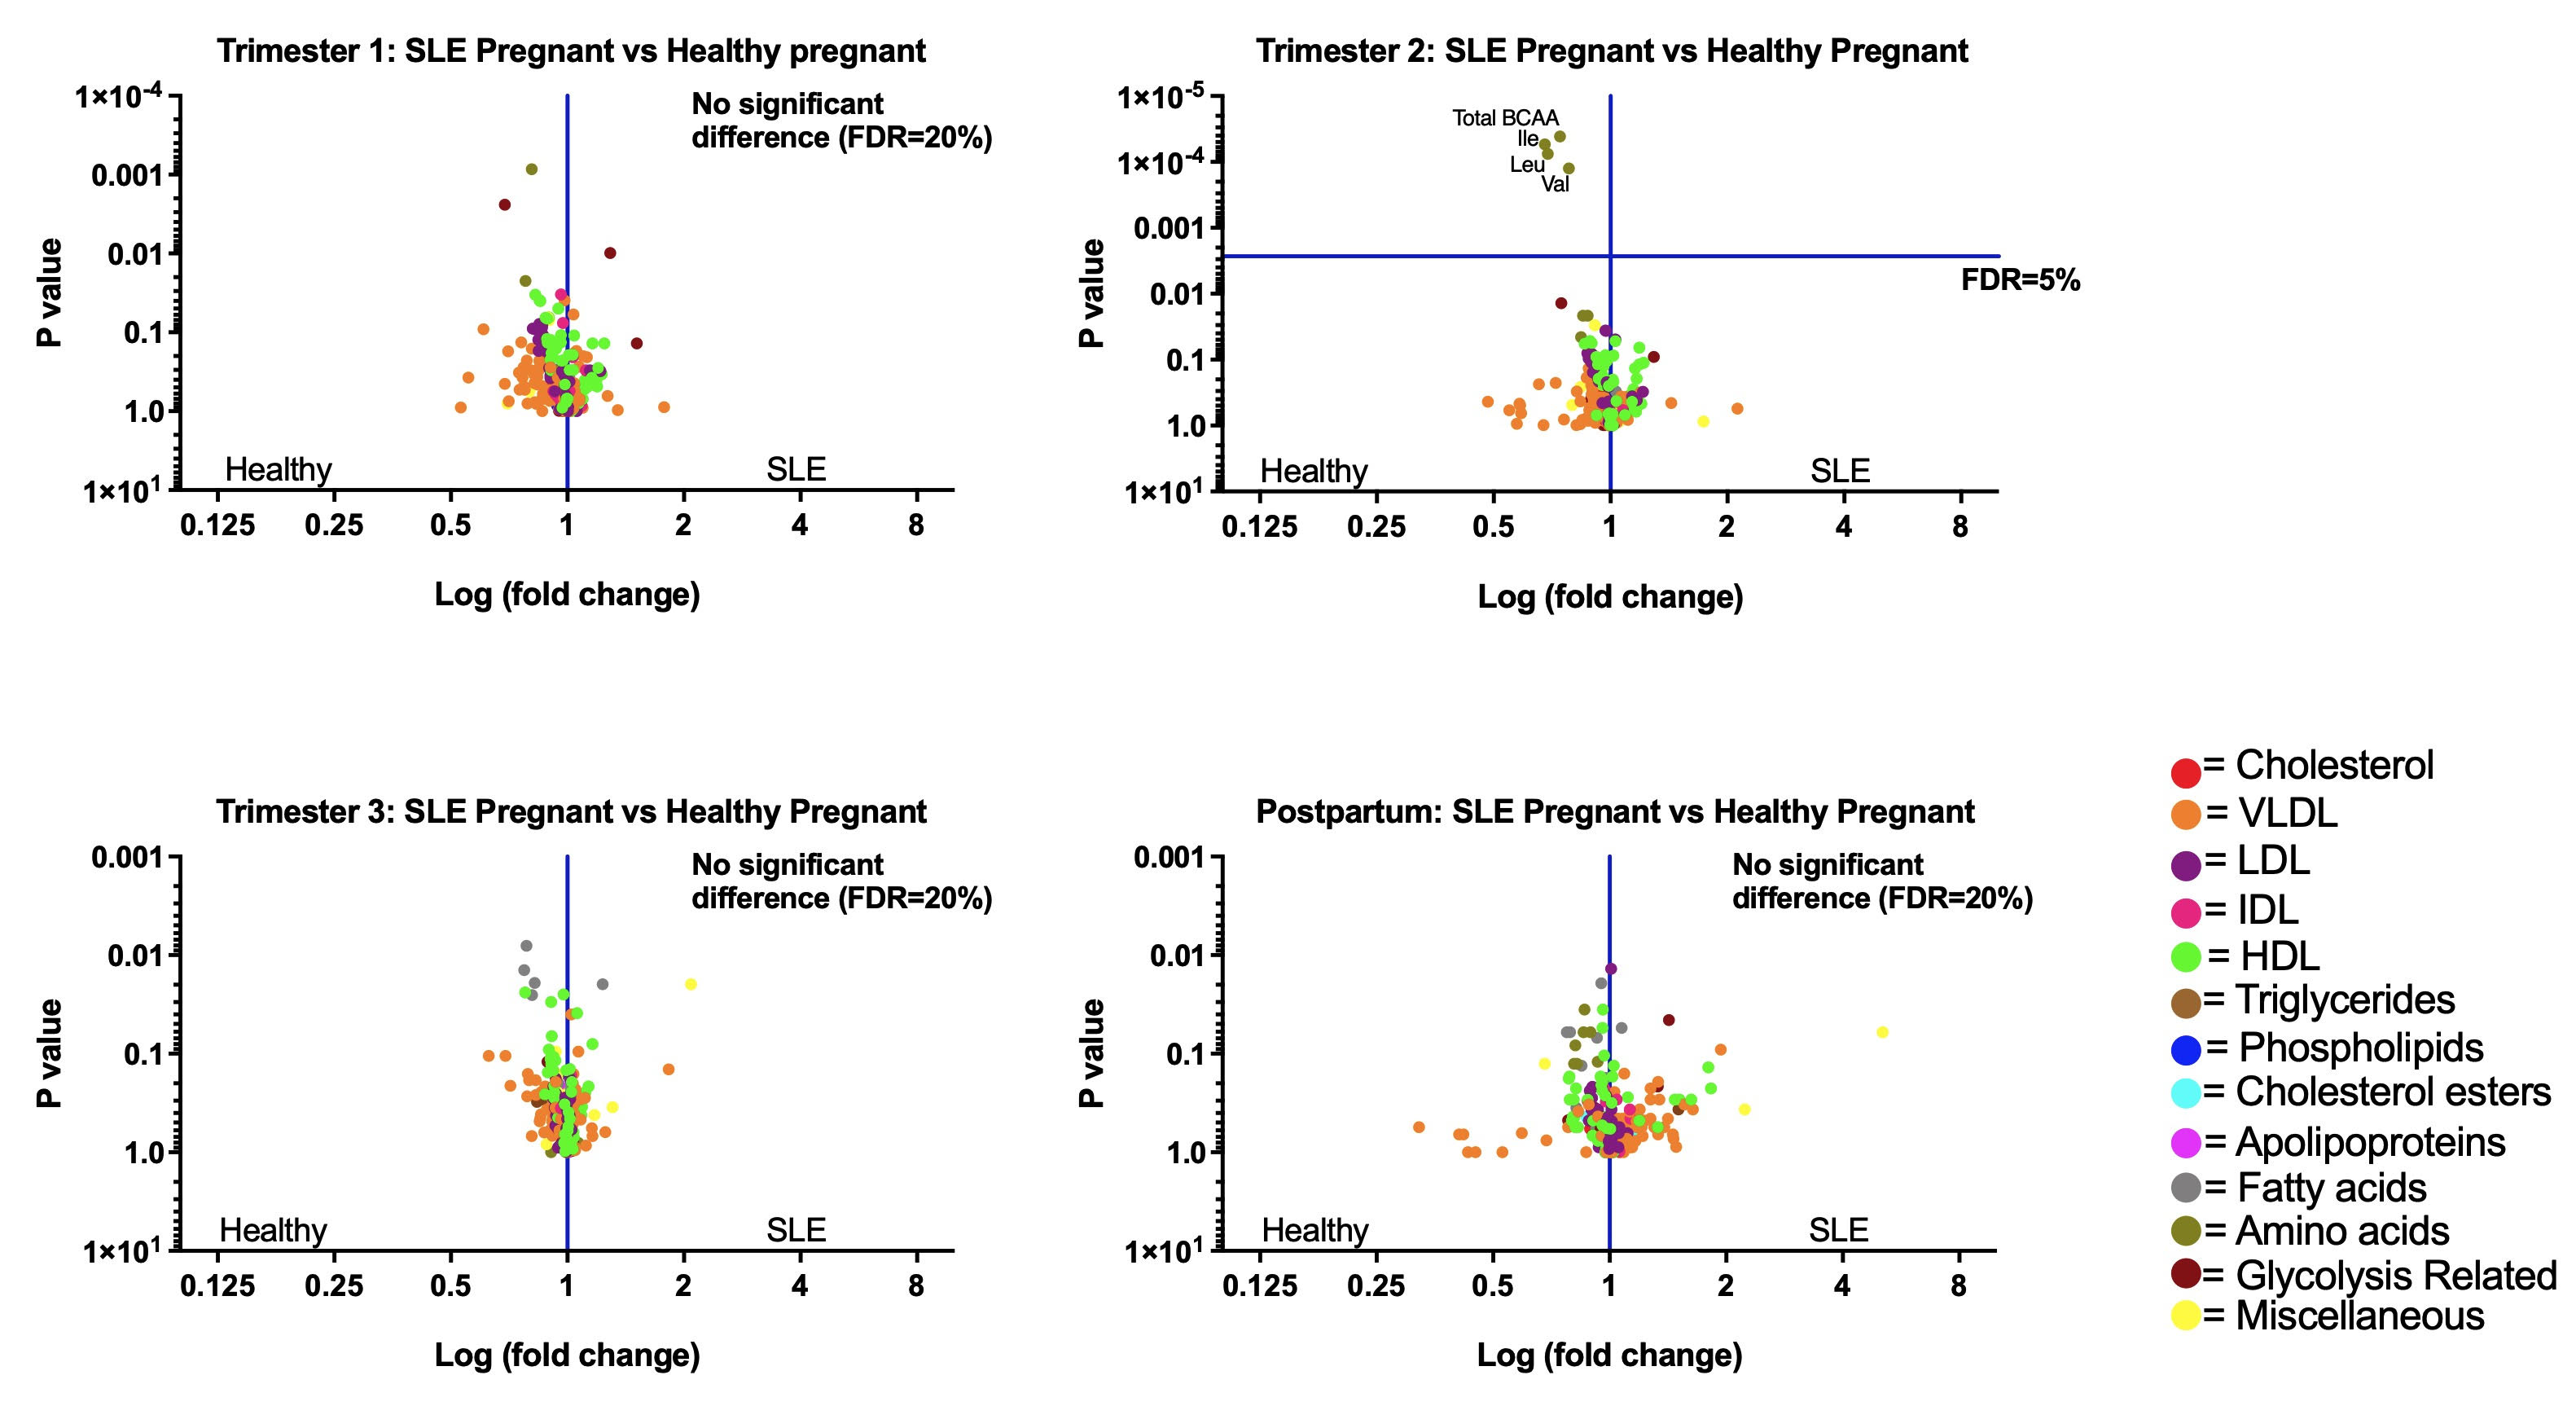 Figure 2: Volcano plots demonstrating a similar metabolic pattern in systemic lupus erythematosus (SLE) pregnancy and healthy pregnancy, with most metabolites peaking in the third trimester. P values calculated using multiple Mann-Whitney tests, significance threshold determined via FDR (false discovery rate) as indicated and represented via a horizontal line. Values to the left of the vertical line were higher in the healthy pregnant group and values to the right higher in the SLE pregnant group. Significantly higher levels of total branch-chained amino acids (p= 0.000041), isoleucine (p= 0.00054), leucine (p=0.000075) and valine (p=0.000125) in the second trimester of the healthy pregnant cohort.