
Poster Session C
Metabolic bone disease
Edgar Wiebe, MD
Charité University Medicine Berlin
Berlin, Germany
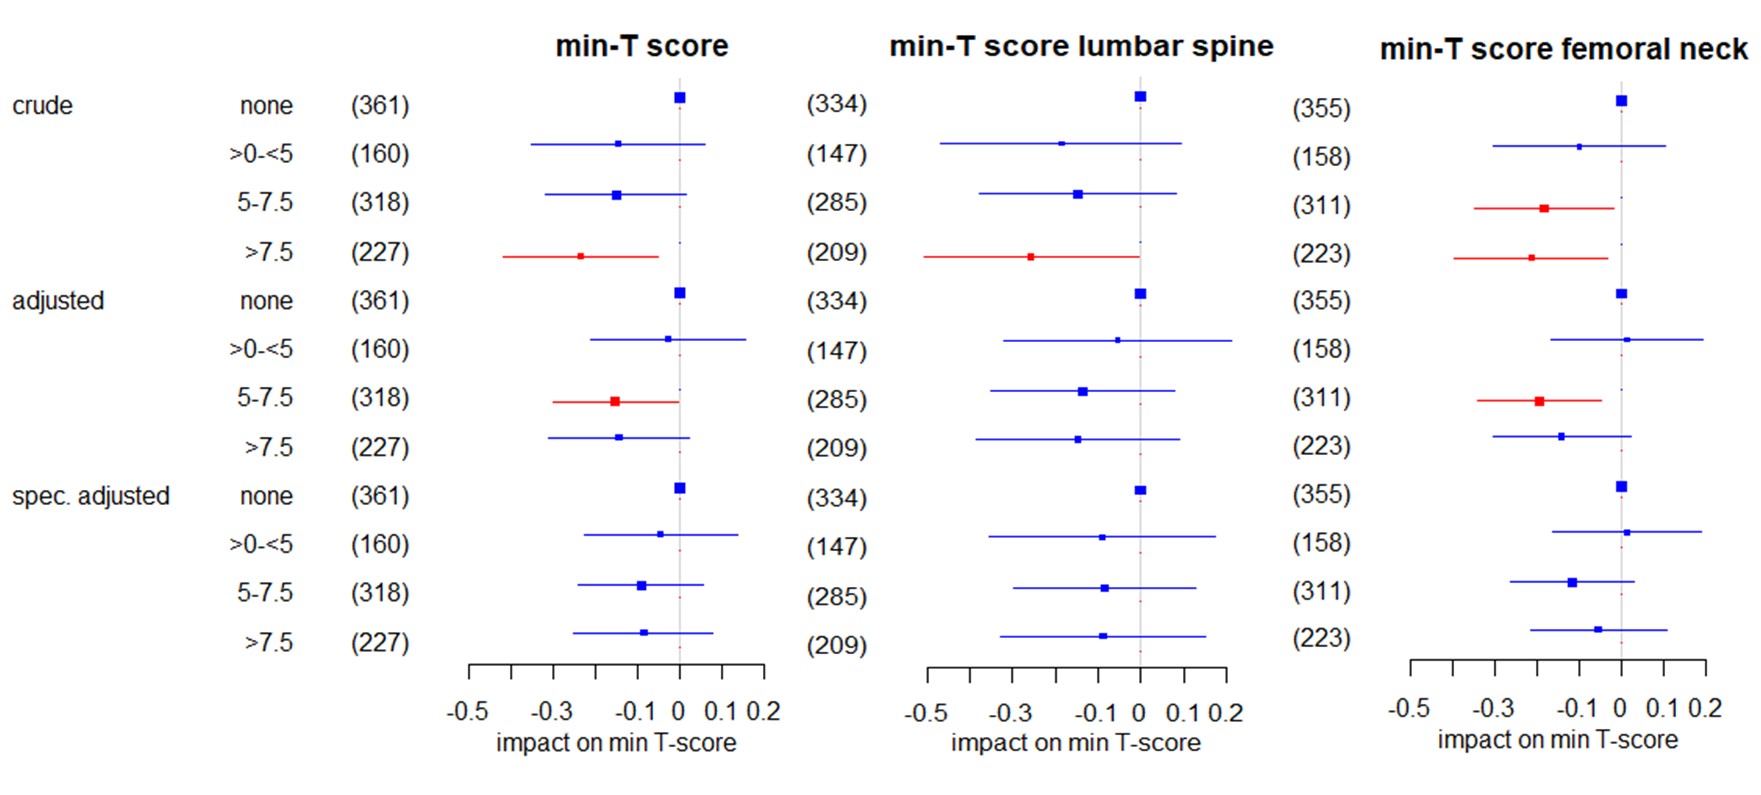 Figure 1: Impact of the current GC dose on the lowest (min-) T-score in all patients in linear regression using: 1) a crude model only including GC categories; 2) a multivariable model adjusted for age, sex, menopause, BMI, alkaline phosphatase, disease duration, bisphosphonates and denosumab; and, 3) a multivariable model specifically adjusted for the variables that emerged in the data mining process and were confirmed with backward selection for the respective T score. The regression coefficients β and respective 95% confidence intervals are shown. Significant coefficients are highlighted in red. The size of the boxes indicates the case numbers, also shown in brackets, of the respective groups; these are the rounded pooled case numbers of the 10 imputed data sets. For “no GC” as the reference group no coefficient was estimated.
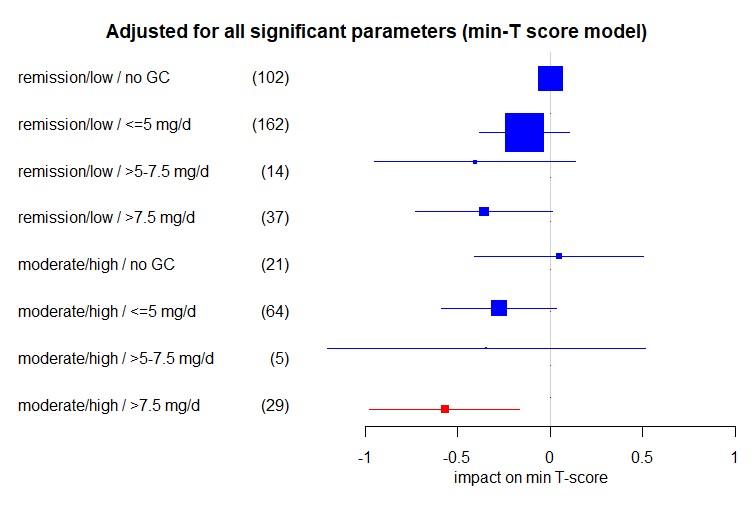 Impact of the interaction of disease activity and current GC dose on the lowest (minimum = min.) T-Score in RA patients in multivariable linear regression adjusted for age, menopause, BMI, alkaline phosphatase, bisphosphonates, disease duration, denosumab, and male sex. Shown are regression coefficients β and respective 95% confidence intervals. Significant coefficients are highlighted in red. The size of the boxes indicates the case numbers, also shown in brackets, of the respective groups; these are the rounded pooled case numbers of the 10 imputed data sets. For “remission/low / no GC” as the reference group no coefficient was estimated.