
Poster Session C
Imaging
Ahmad Almhdie-Imjabbar, PhD
Université d'Orléans
Orléans, France
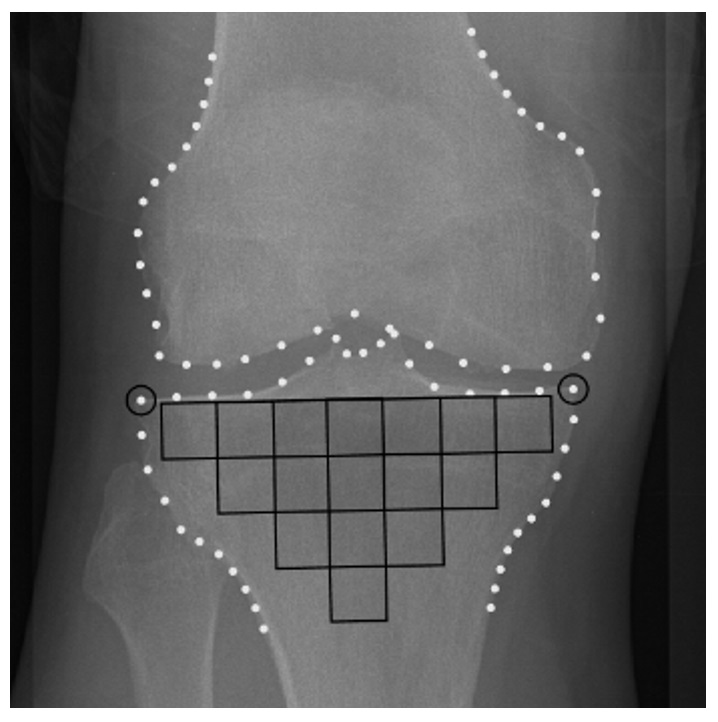 Figure 1: ROIs automatically selected in the tibial subchondral bone, based on the femoral and tibial bone contour points, weight dots, delimited by BoneFinder® software
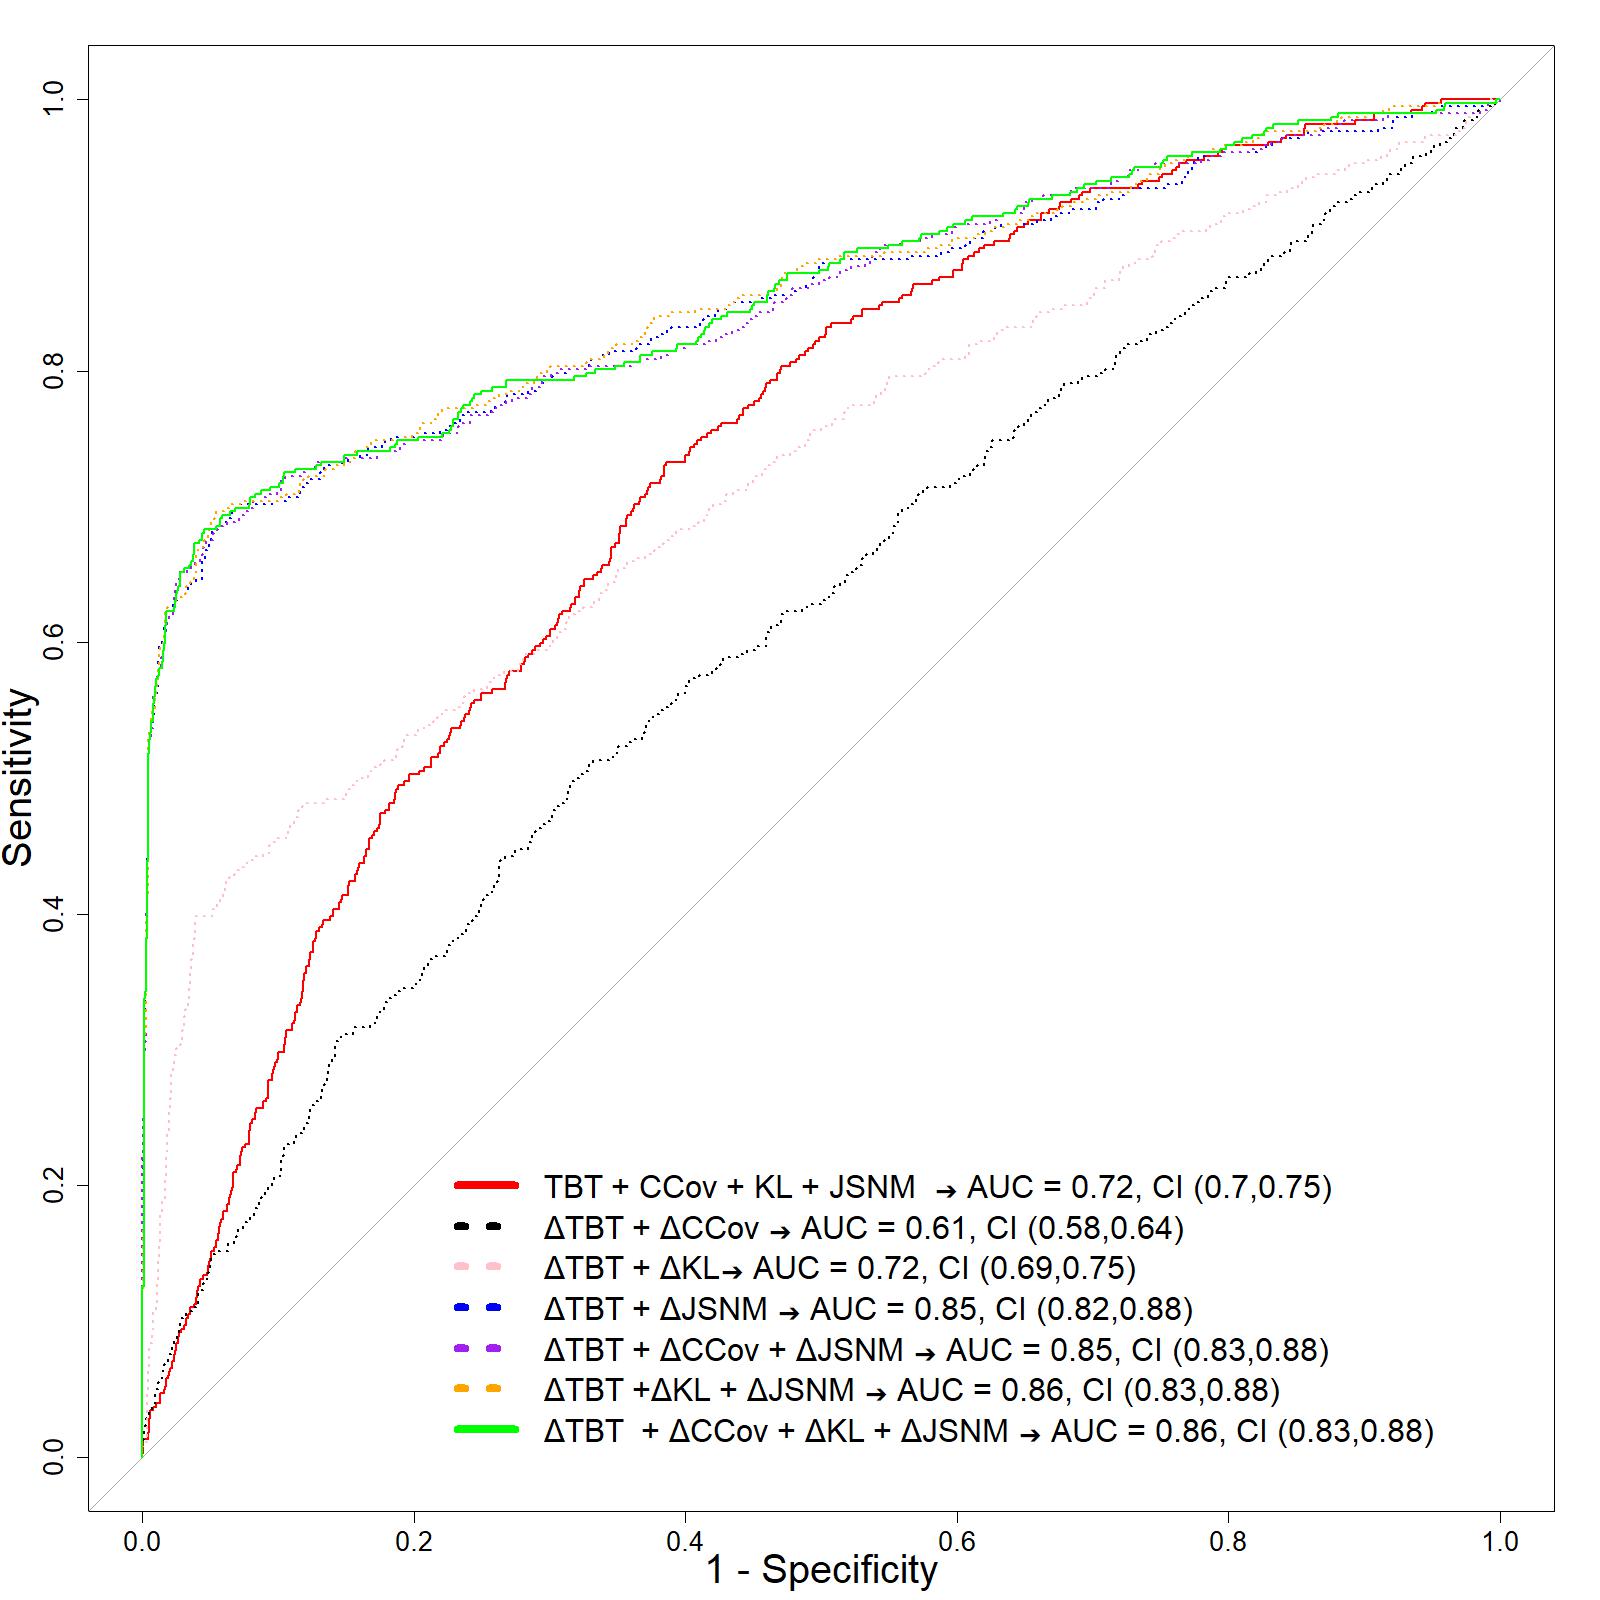 Figure 2: ROC curves comparisons of several prediction models using longitudinal variations in TBT, KL, JSNM, BMI and WOMAC parameters