
Poster Session D
Emma Leisinger, BS
University of Iowa
Iowa City, IA, United States
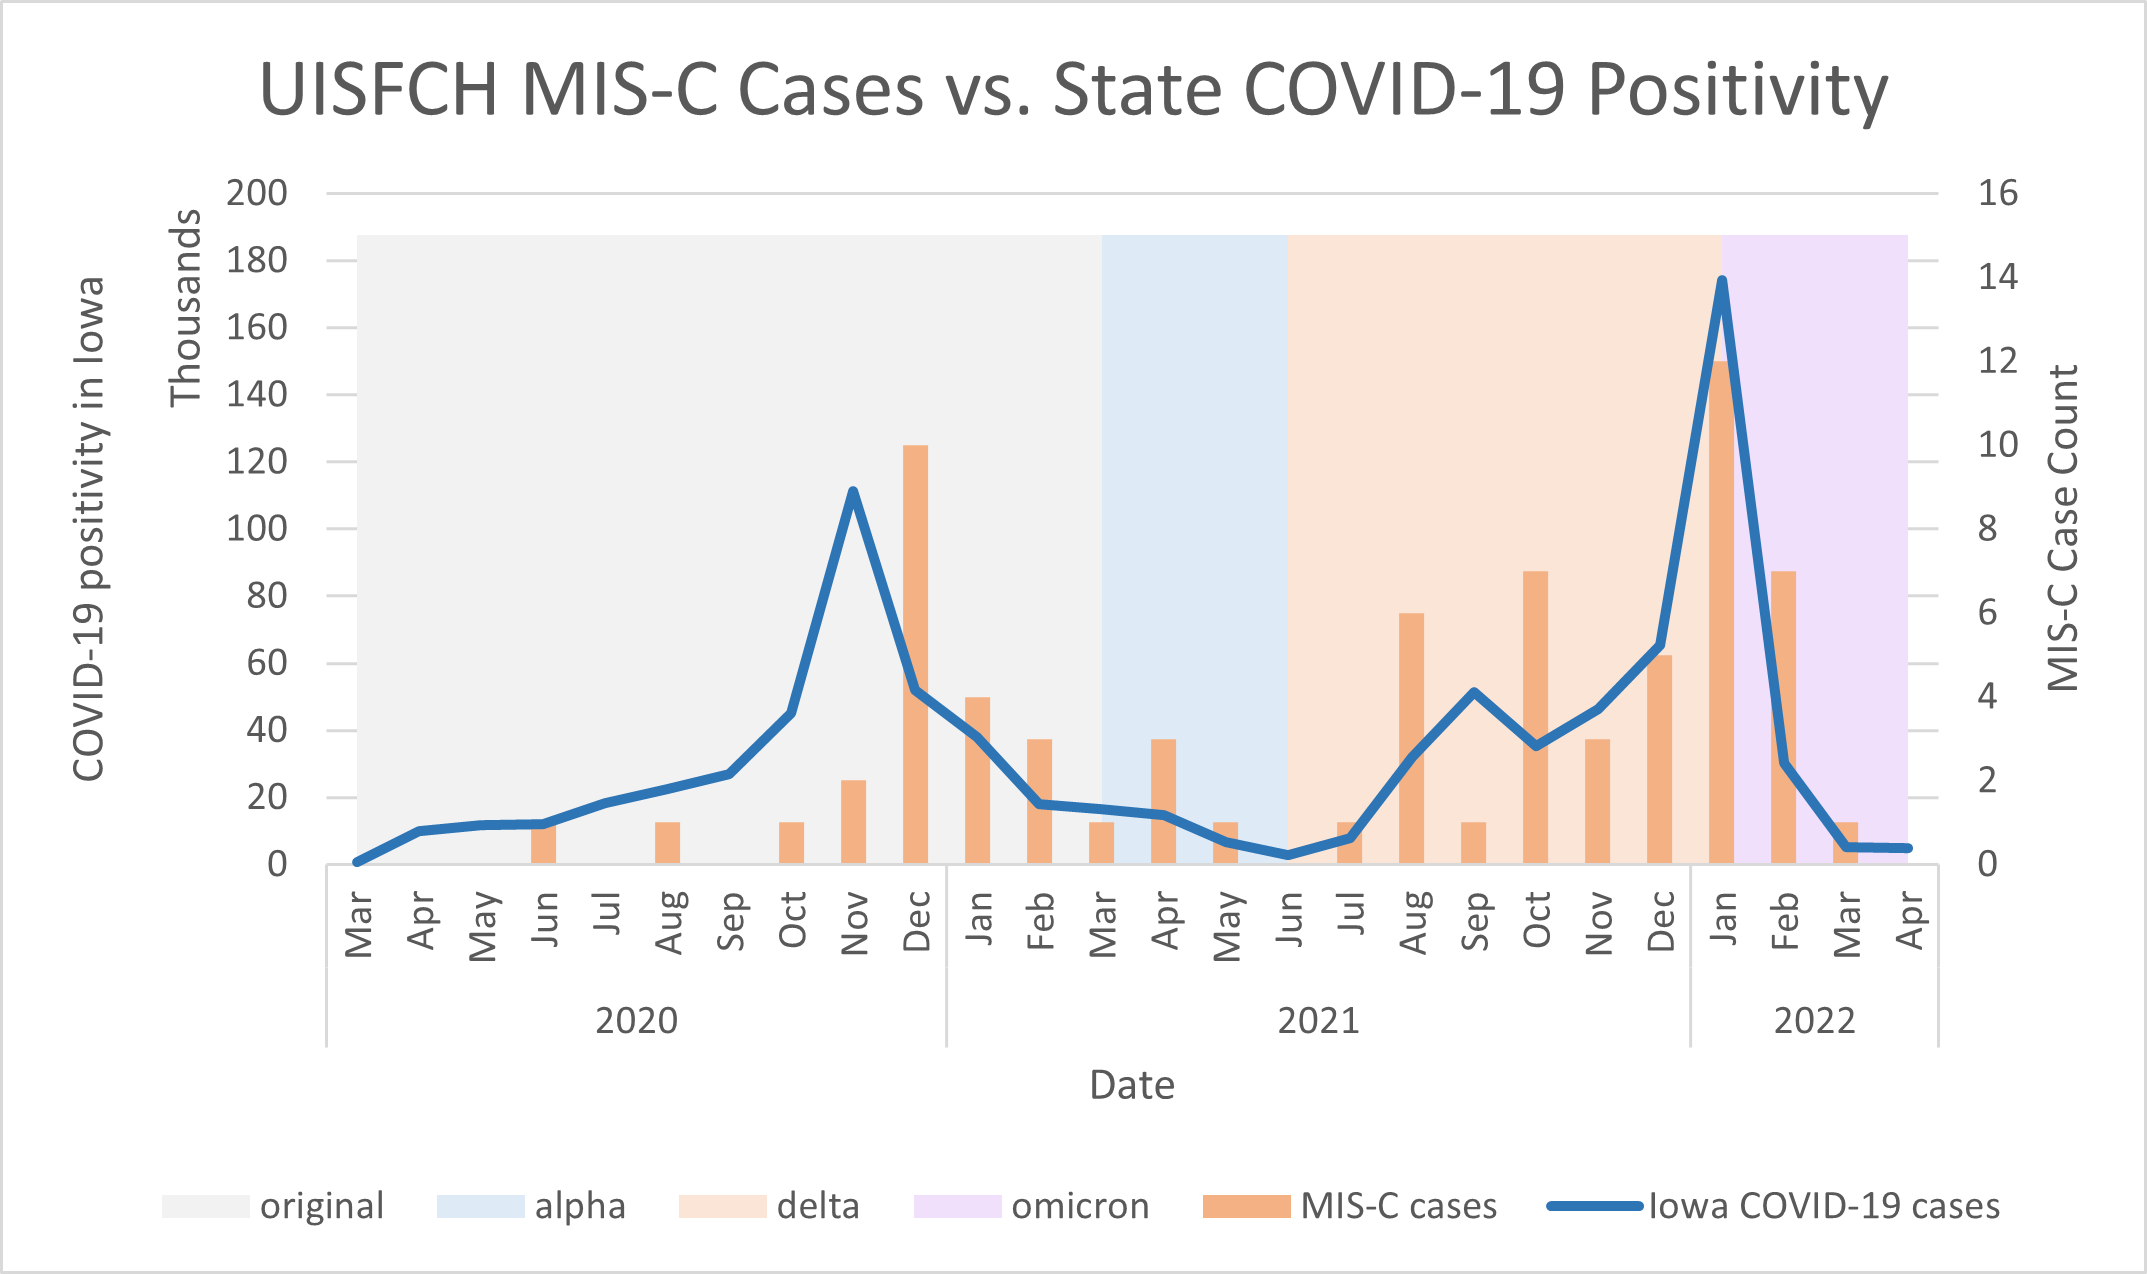 Figure 1: MIS-C case count per month was compared with positive tests (in thousands) over the course of the pandemic. Background coloring indicates the dominant SARS-CoV-2 variant in the state of Iowa. Original variant (grey) outlines the time in which state testing for variant type was not readily available.
 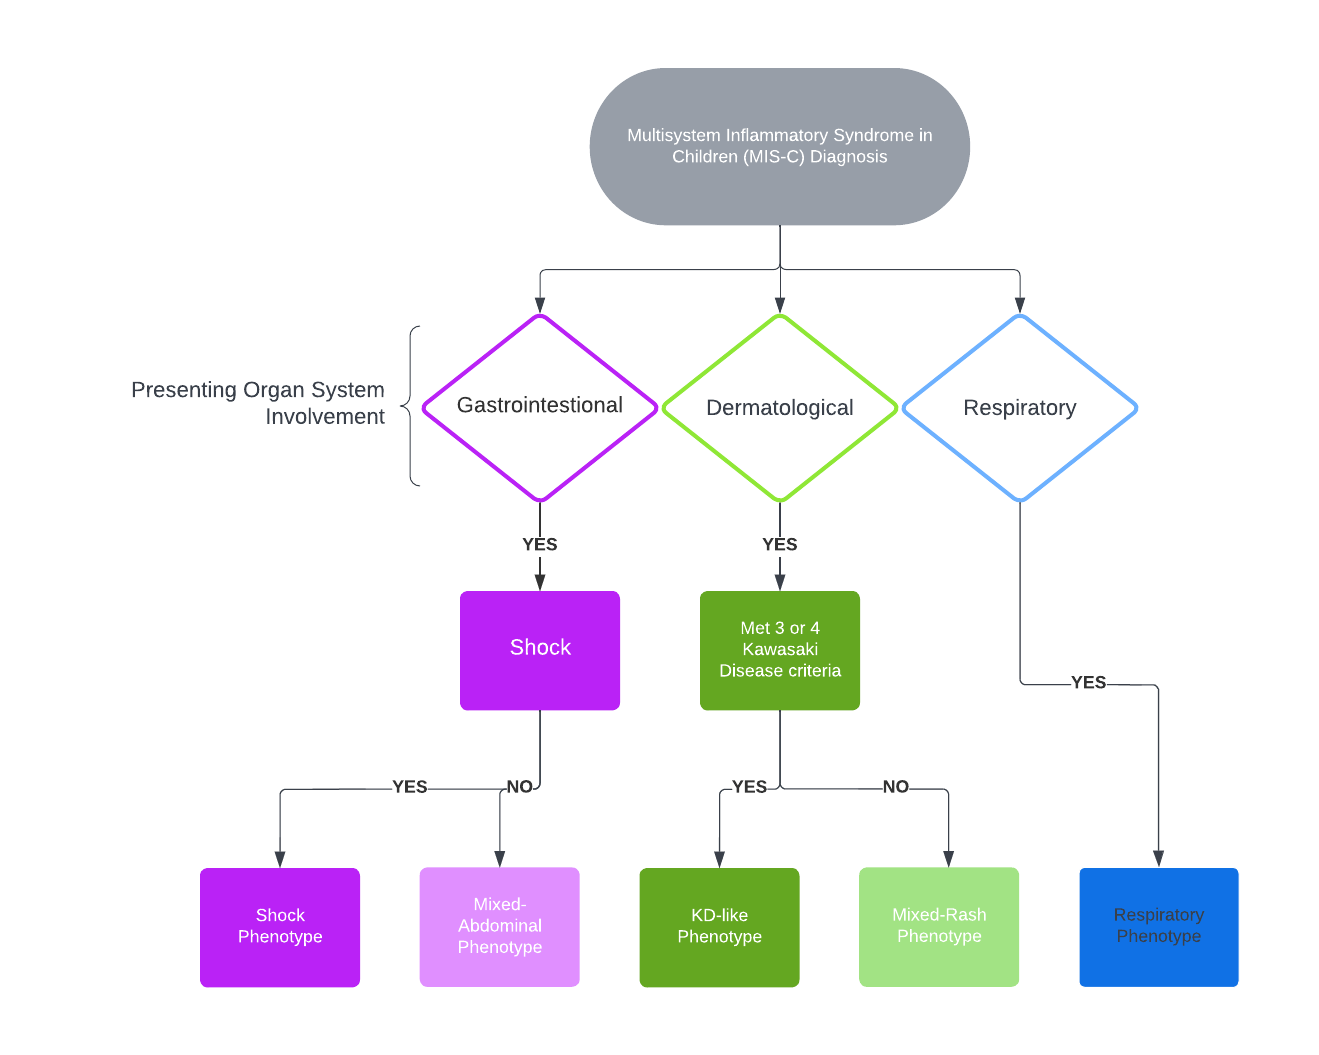 Figure 2: Flow diagram outlining classification of phenotype based on presenting organ system involvement. All patients met MIS-C criteria. Gastrointestinal involvement included abdominal pain, nausea, vomiting, and diarrhea. Dermatologic involvement included conjunctivitis muco-cutaneous changes, periorbital edema, erythema of hands and feet and morbilliform rashes. KD criteria was based on the AHA KD 2017 Guidelines.
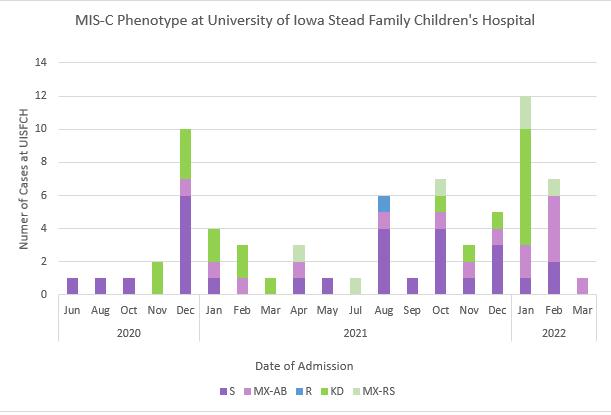 Figure 3: Cases of MIS-C admitted at UISFCH over the course of the pandemic displayed in admissions per month. Patients were categorically colored based on phenotype. Purple coloring indicates gastrointestinal involvement; patients with shock in dark purple and mixed-abdominal (no shock) in light purple. Green coloring indicated dermatologic features with those meeting criteria for KD or incomplete KD in dark green and those not meeting criteria but having prominent rash categorized as mixed rash in light green. Blue coloring indicated the respiratory phenotype.