
Abstract Session
Pediatric autoimmune diseases: Kawasaki disease, juvenile dermatomyositis and juvenile localized scleroderma

Santiago Arciniegas, BSc
University of Toronto
Toronto, ON, Canada
.jpg) Table 1. All variables listed under Disease Measures were used in PLS Analysis, except for the “NPSLE diagnosis” variable.
Table 1. All variables listed under Disease Measures were used in PLS Analysis, except for the “NPSLE diagnosis” variable.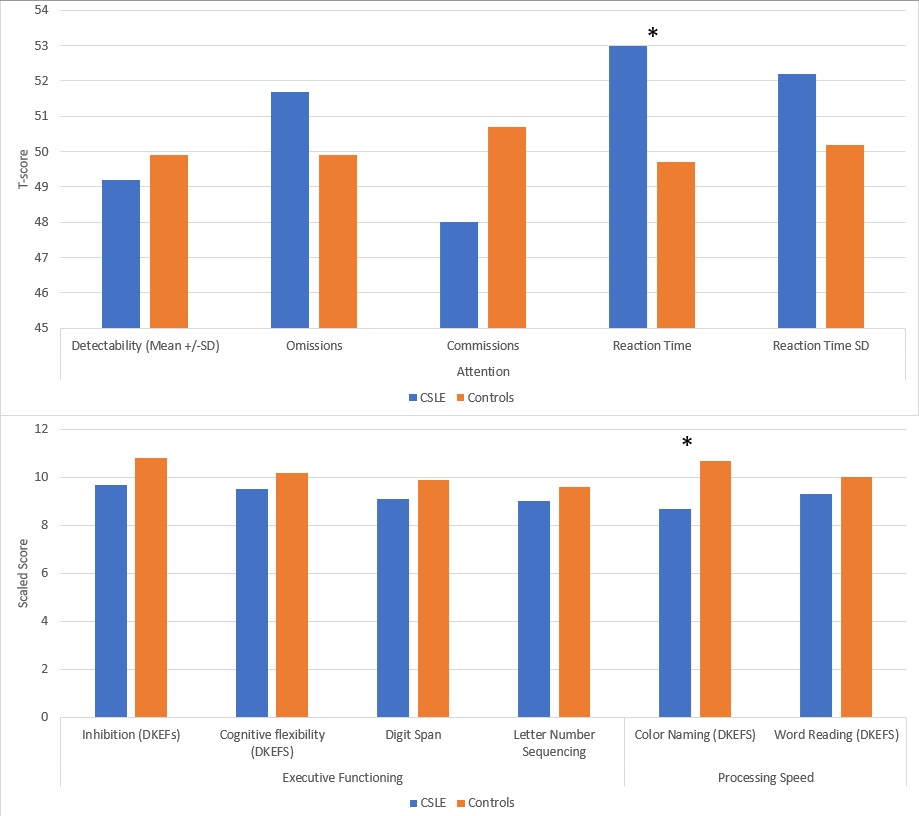 Figure 1. Mean scores of patients with cSLE (n=30) and healthy controls (n=18). An asterisk (*) represents statistically significant group differences for a particular measure (p < 0.05). Attention was measured by the Conners’ Continuous Performance Task III via standardized T scores (normative mean of 50, standard deviation of 10); higher scores indicate more difficulties. Measures of executive functioning and processing speed were measured by the Delis-Kaplan Executive Function System (D-KEFS, normative mean of 10, standard deviation of 3); lower scores indicate more difficulties.
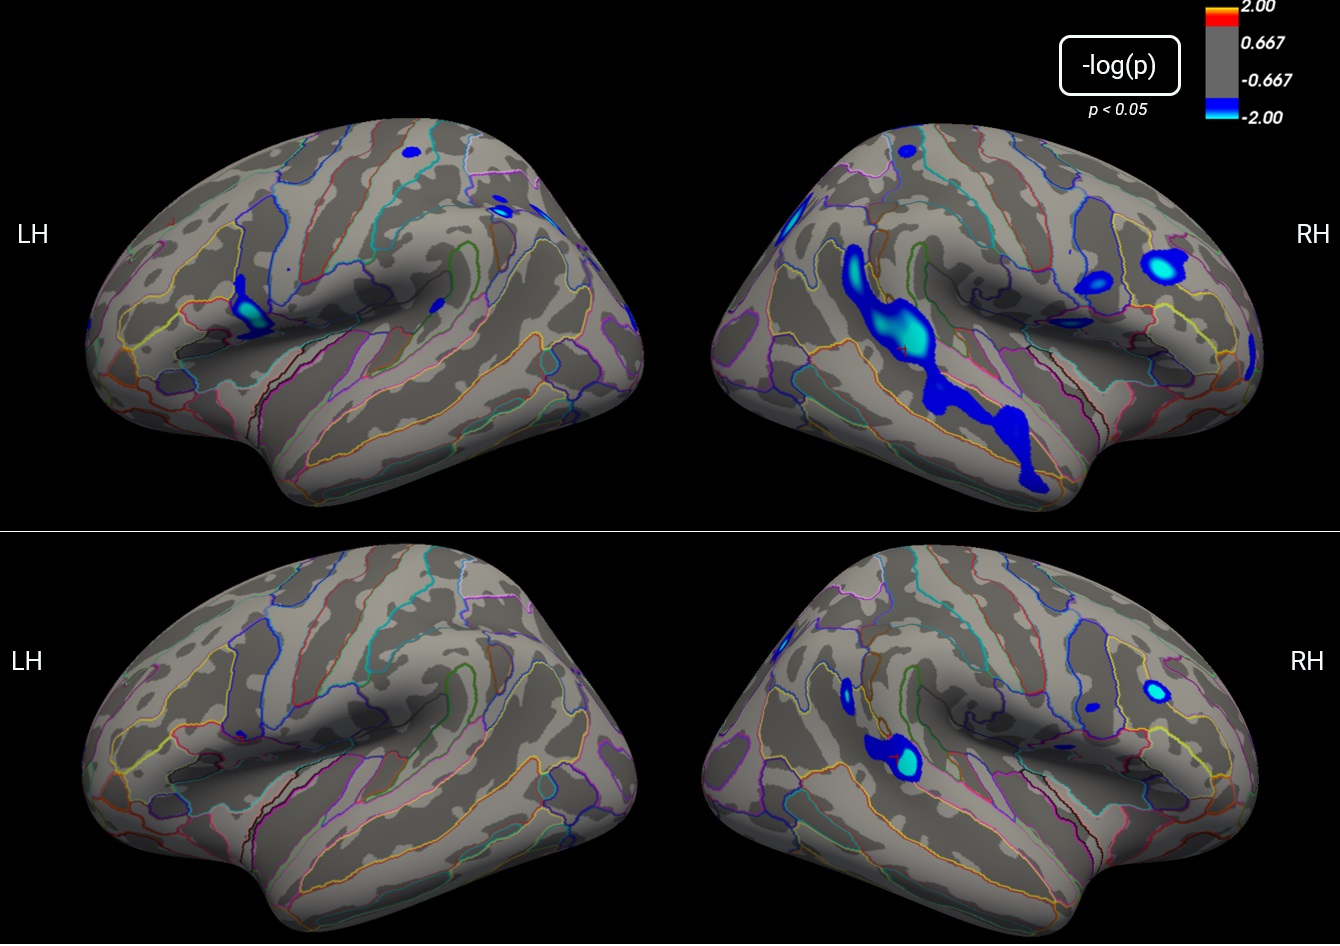 Figure 2. Cortical maps representing vertex-wise differences in surface area between patients with cSLE (n=30), and age/sex-matched controls (n=18). Blue colour indicates regions with statistically significant decreases in surface area in the cSLE group when compared to controls (p < 0.05). Coloured outlines annotate brain regions according to the Destrieux atlas. The top and bottom panels represent structural results before and after correcting for multiple comparisons, respectively.