
Abstract Session
Epidemiology, health policy and outcomes
Brooke McGinley, BS, BA
Boston University
Boston, MA, United States
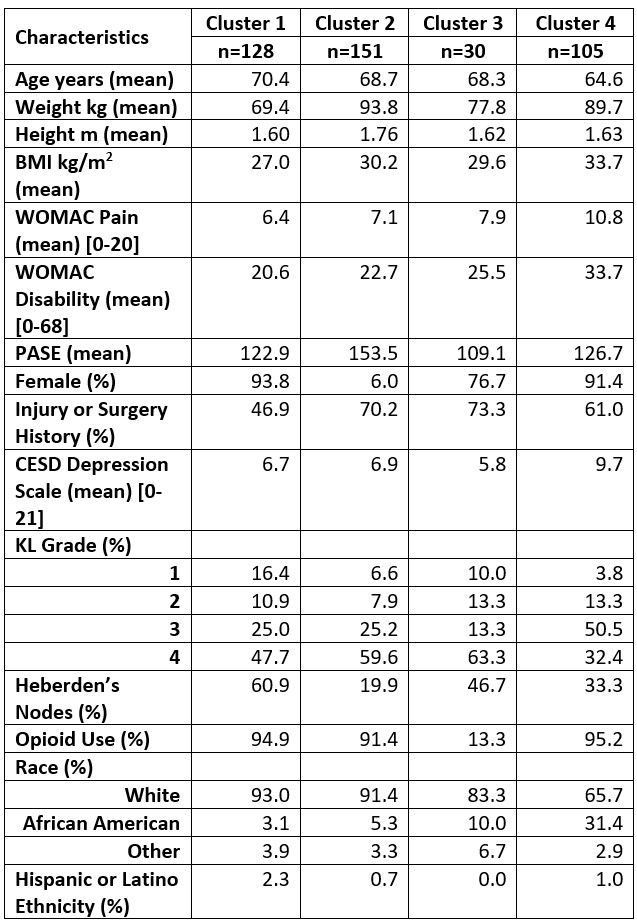 Cells in table give cluster-specific means for continuous variables and percentages for categorical variables.
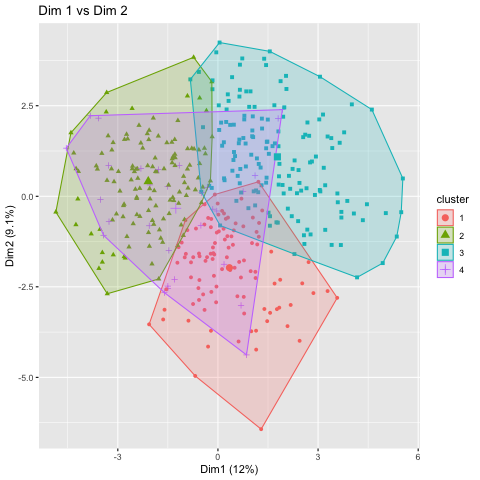 The 4 clusters plotted against principal components dimension 1 (X-Axis) and dimension 2 (Y-Axis). Clusters 1,2, and 3 show good separation in these dimensions.
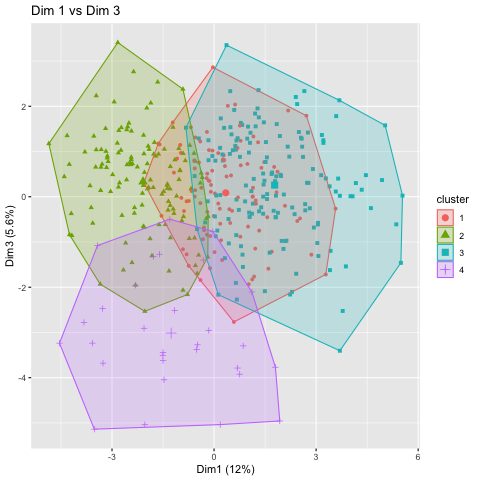 The 4 clusters plotted against principal components dimension 1 (X-Axis) and dimension 3 (Y-Axis). Cluster 4 shows good separation from the other clusters using dimension 3.