
Poster Session B
Systemic lupus erythematosus (SLE)
Felix Chin, BS
University of Pennsylvania Perelman School of Medicine
Philadelphia, PA, United States
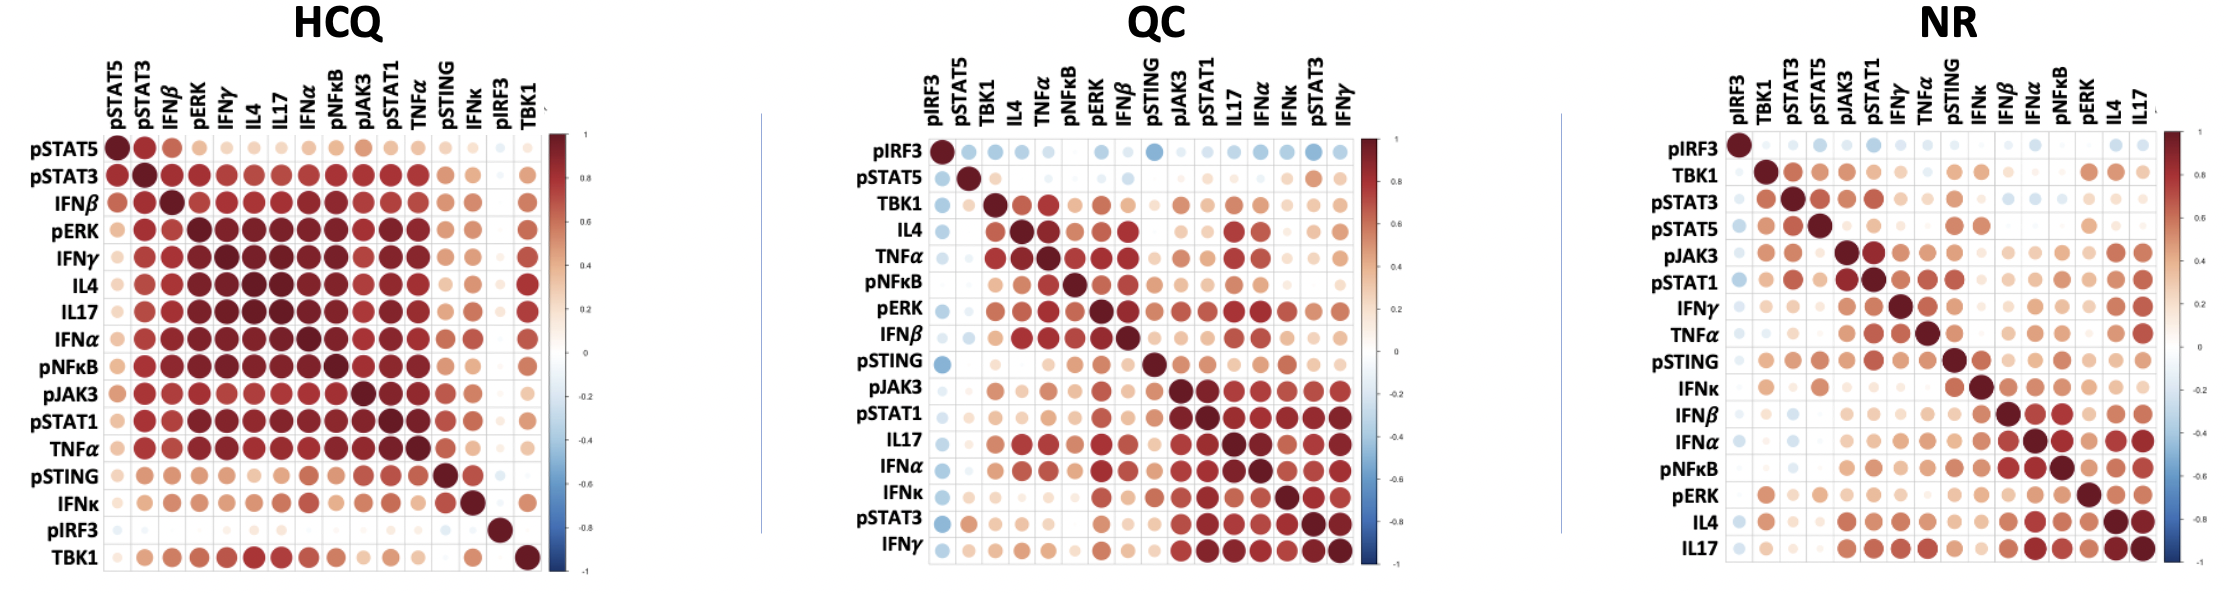 Fig 1. Size of each dot is a reflection of correlation strength (red = positive). Correlations were grouped using hierarchical clustering. HCQ shows single large cluster indicating pathways coexist together homogeneously. QC shows two main clusters suggesting two potential mechanisms responsive to quinacrine. NR shows no clusters indicating significant heterogeneity.
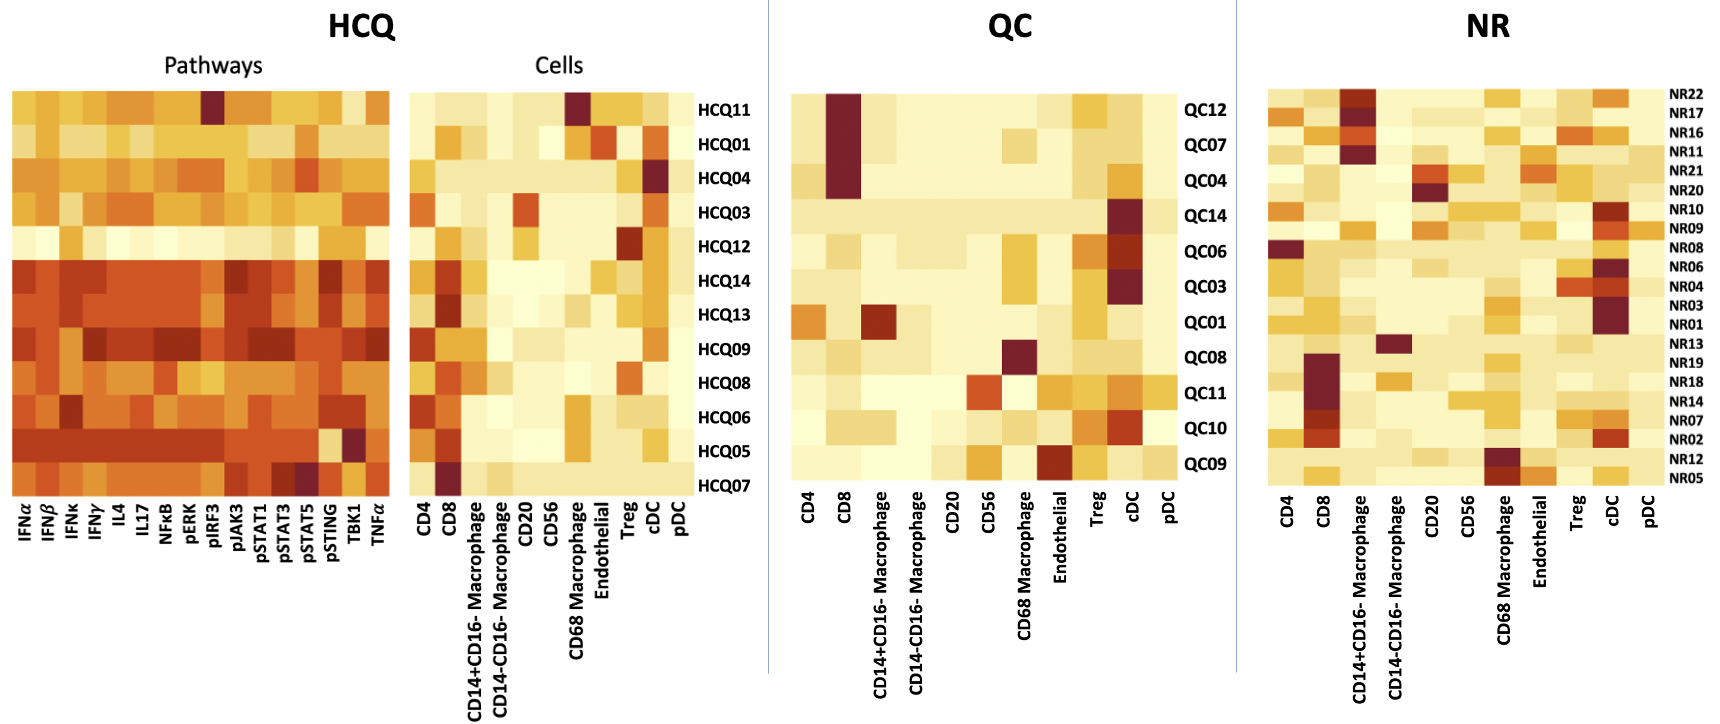 Fig 1. K-means clustered heatmaps illustrating the different cell clusters that exist within the three treatment response groups. Each row represents a single patient. Greater CD4/CD8 activity appeared to correlate with general pathway activity in the HCQ group. QC and NR clusters contain similarities in terms of single-cell dominance, both showing CD8 and cDC-predominant subgroups..