
Poster Session B
Systemic lupus erythematosus (SLE)
Prathyusha Bachali, MS
AMPEL BioSolutions
Redmond, WA, United States
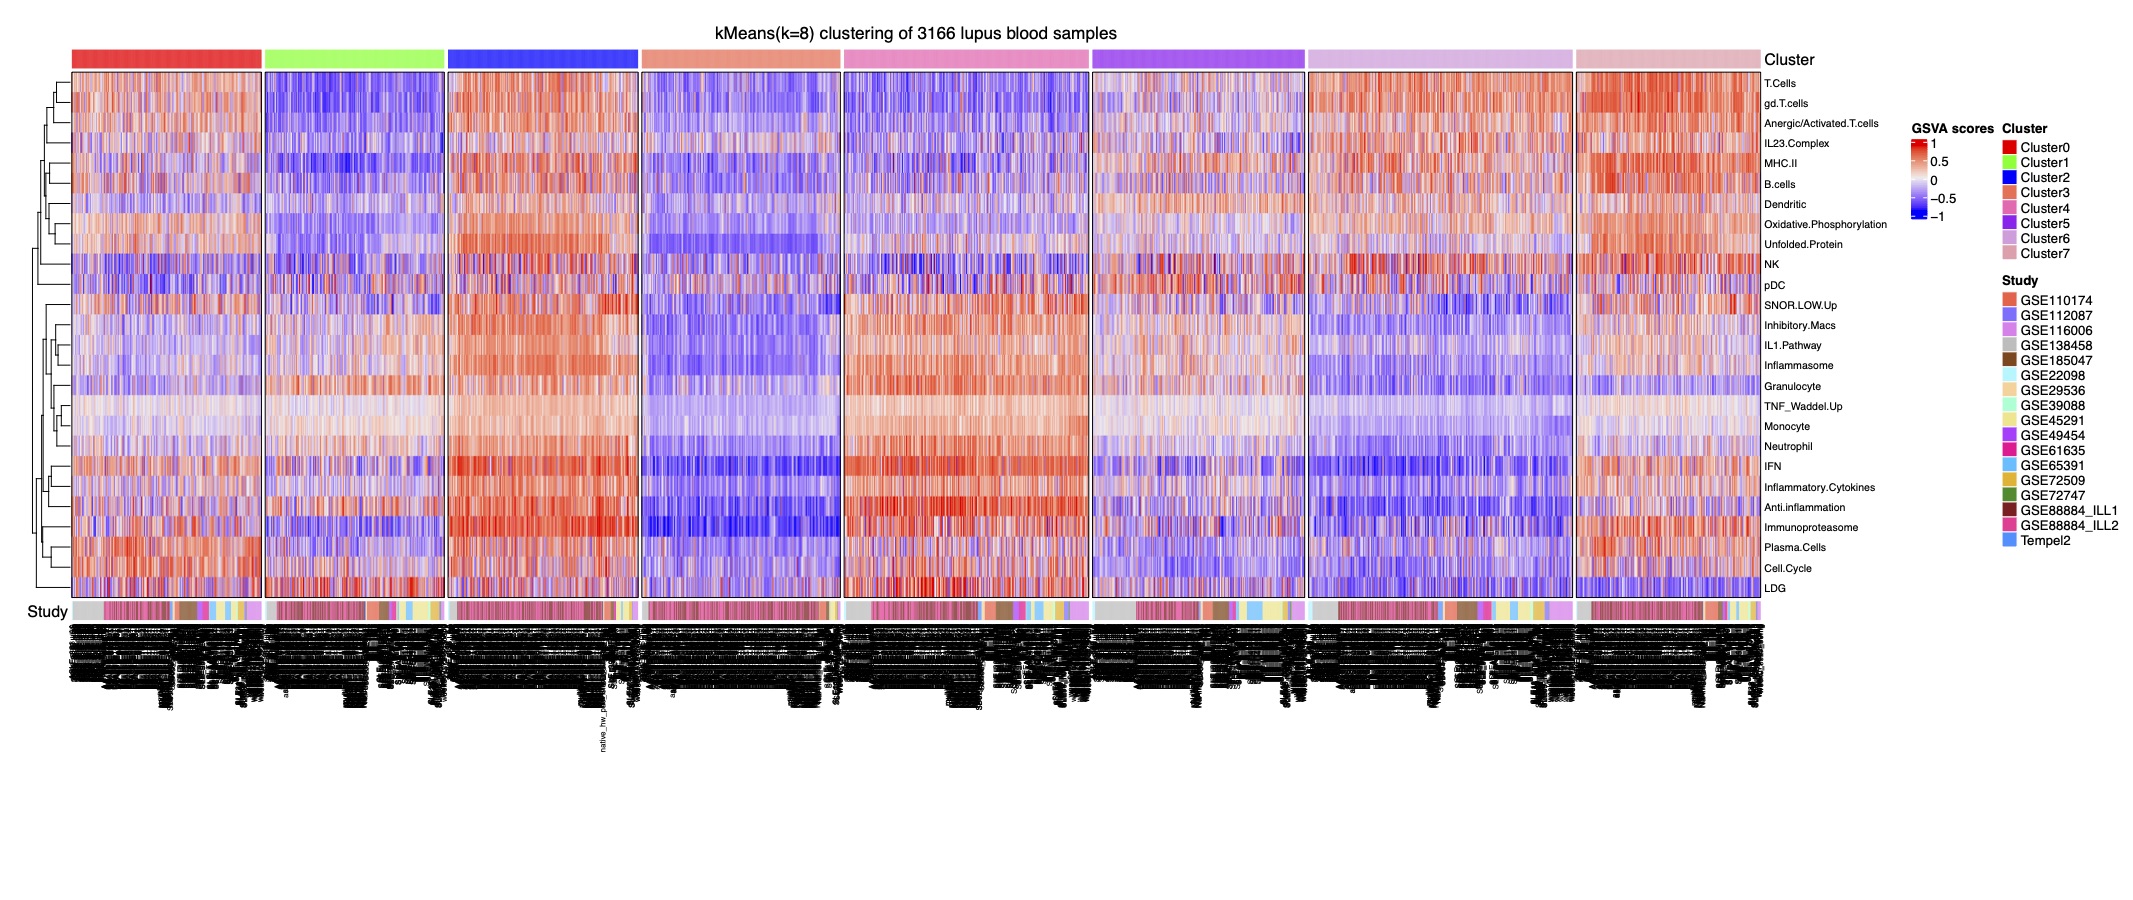 Figure 1. Stable k-Means clustering analysis of 3,166 samples reveals eight lupus subsets. Heatmap of k-means clustering using GSVA enrichment scores for 32 cell and pathway modules (rows) in 3,166 samples (columns).
 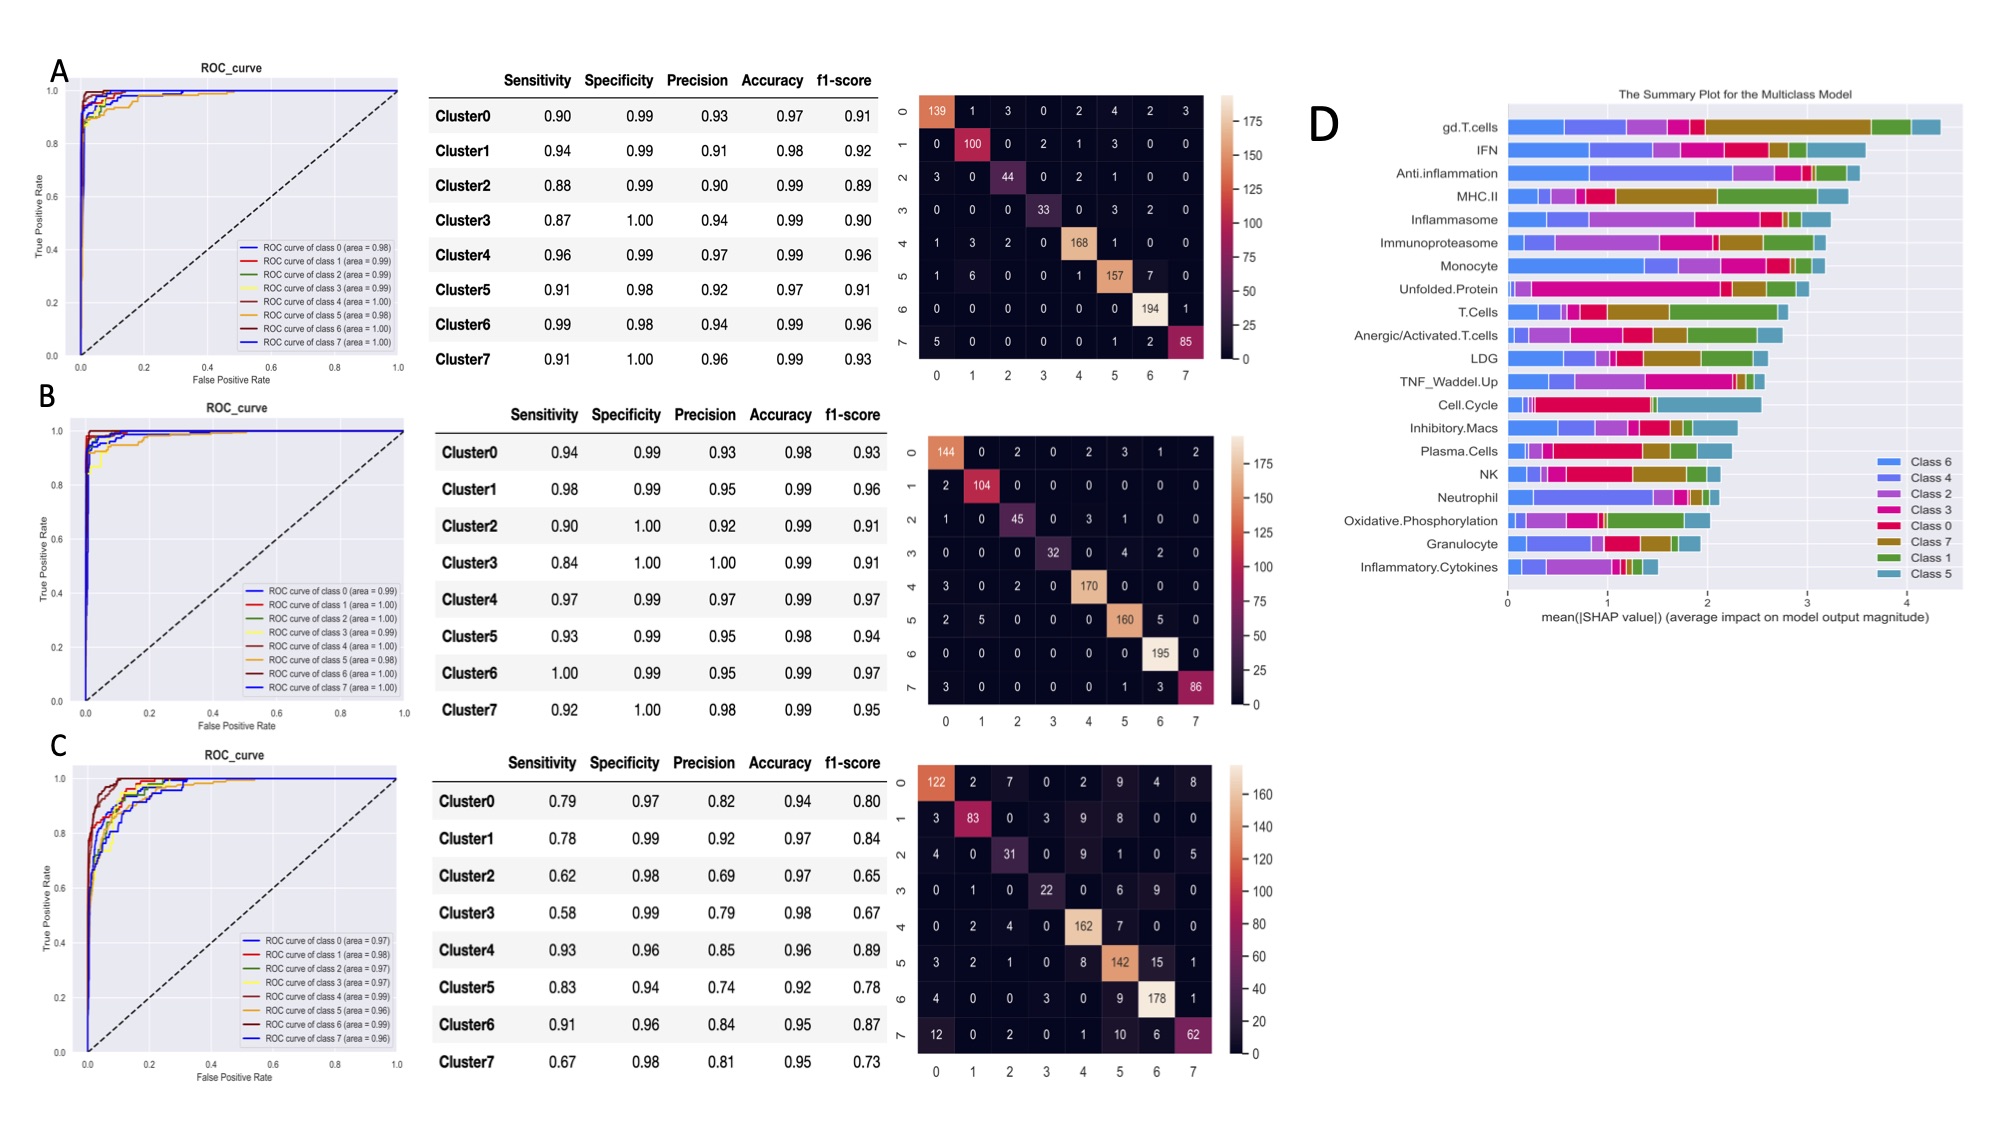 Figure 2. Machine learning algorithms can predict lupus subset memberships with high accuracy and identify the key contributors. Area under the ROC curve (AUC), performance metrics, and confusion matrices of each of 3 classifiers are summarized: (A) support vector machine, (B) logistic regression, and (C) random forest. Each model was trained and validated on 2,183 samples and tested on the 13 independent datasets (n=983). (D) Top 20 key contributors identified by SHapley Additive exPlanations (SHAP).
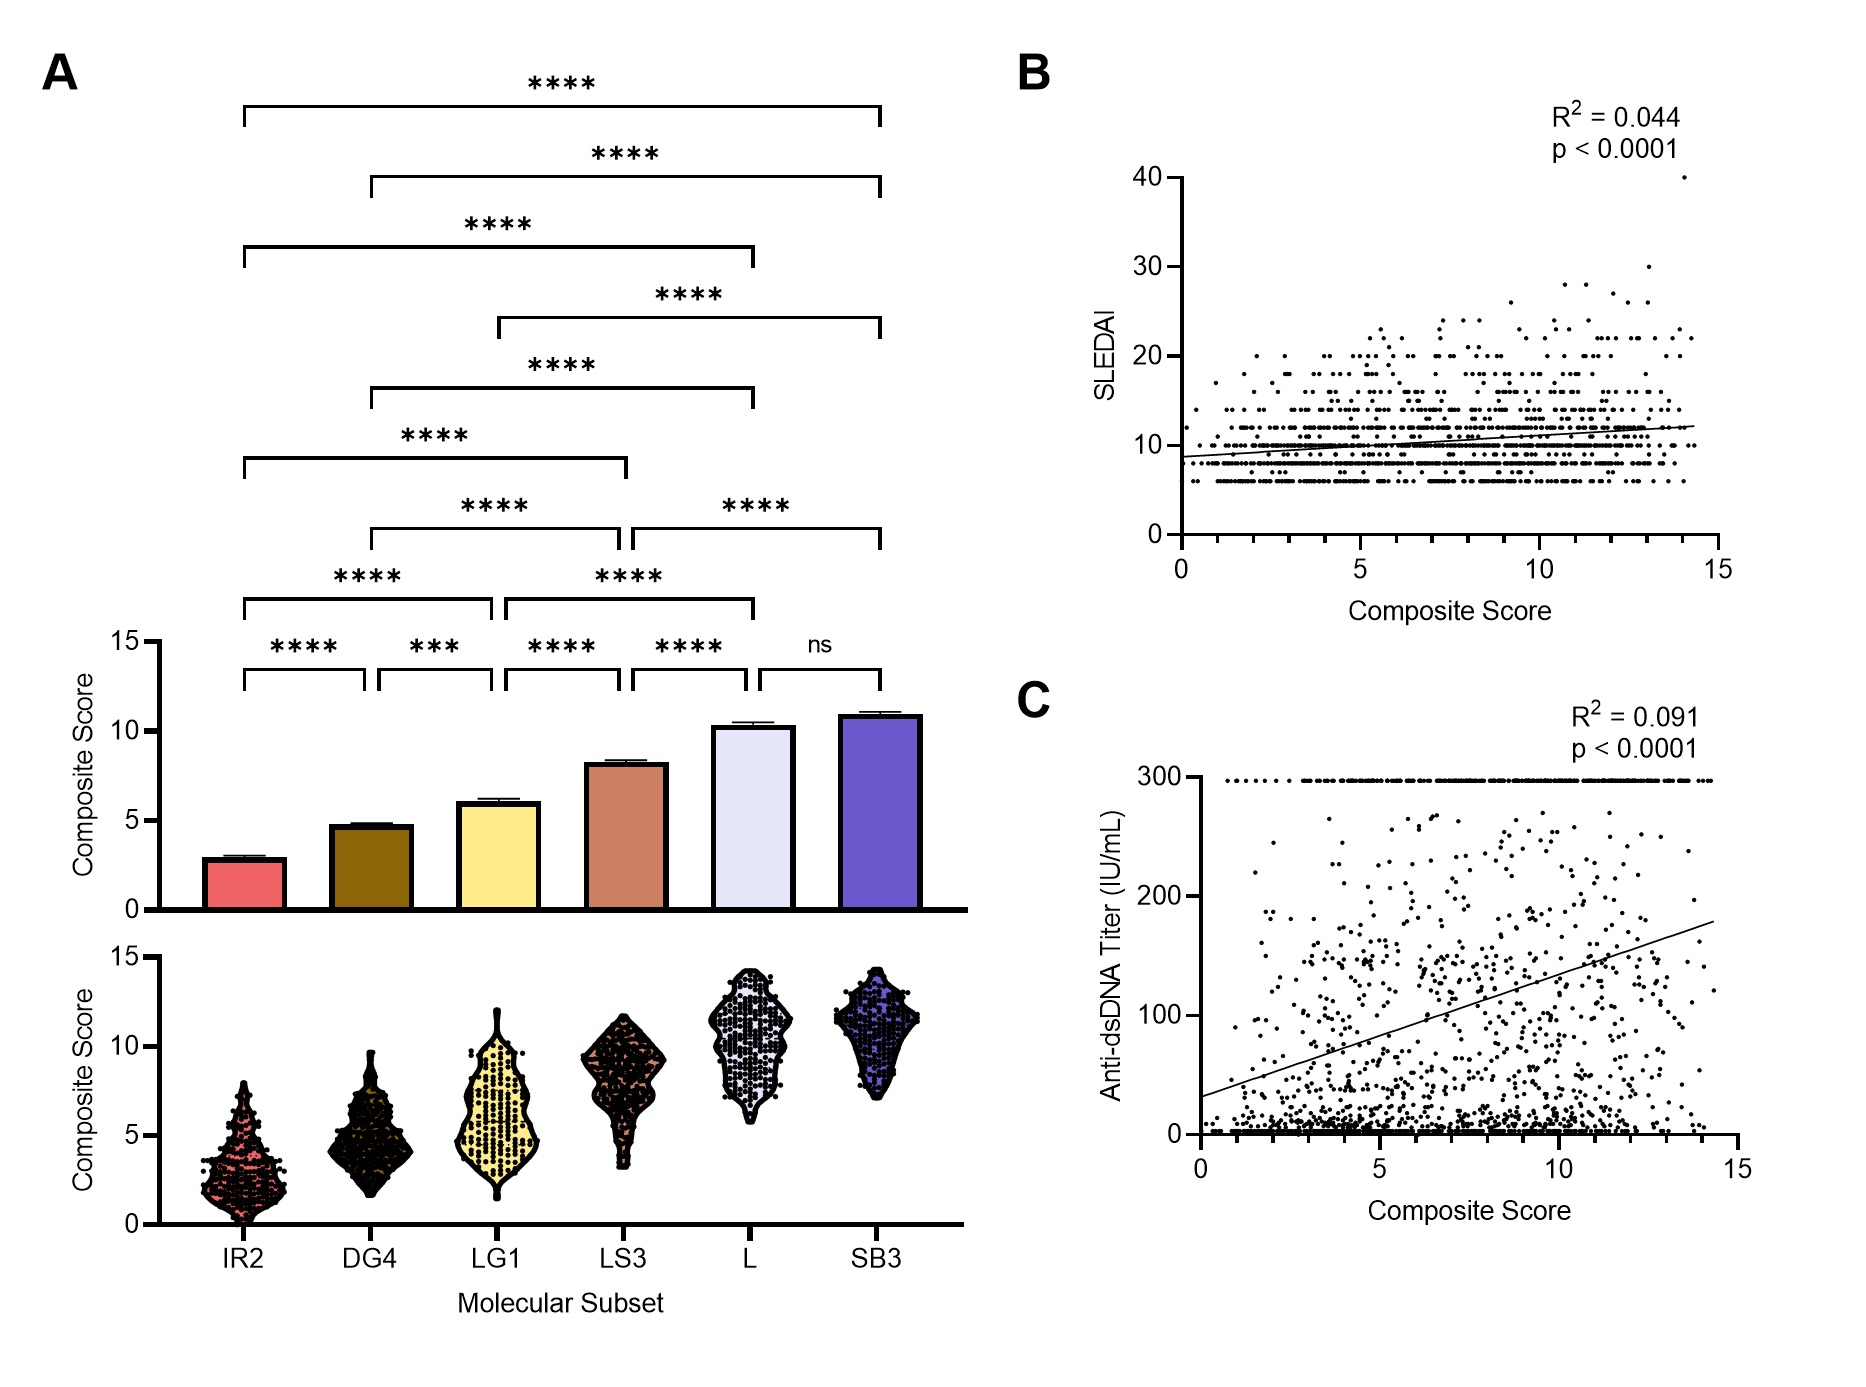 Figure 3. Gene expression-based molecular score as a metric to determine lupus patient disease severity. (a) The mean + SEM (top) and distribution (bottom) of the composite molecular score for the six molecular subsets in GSE88884. Statistical differences between mean scores of the molecular subsets were evaluated with Kruskal-Wallis test with Dunn’s multiple comparisons. Linear regression between (b) SLEDAI or (c) Anti-dsDNA and the molecular score.