
Abstract Session
Pui Lee, MD, PhD
Boston Children's Hospital
Newton, MA, United States
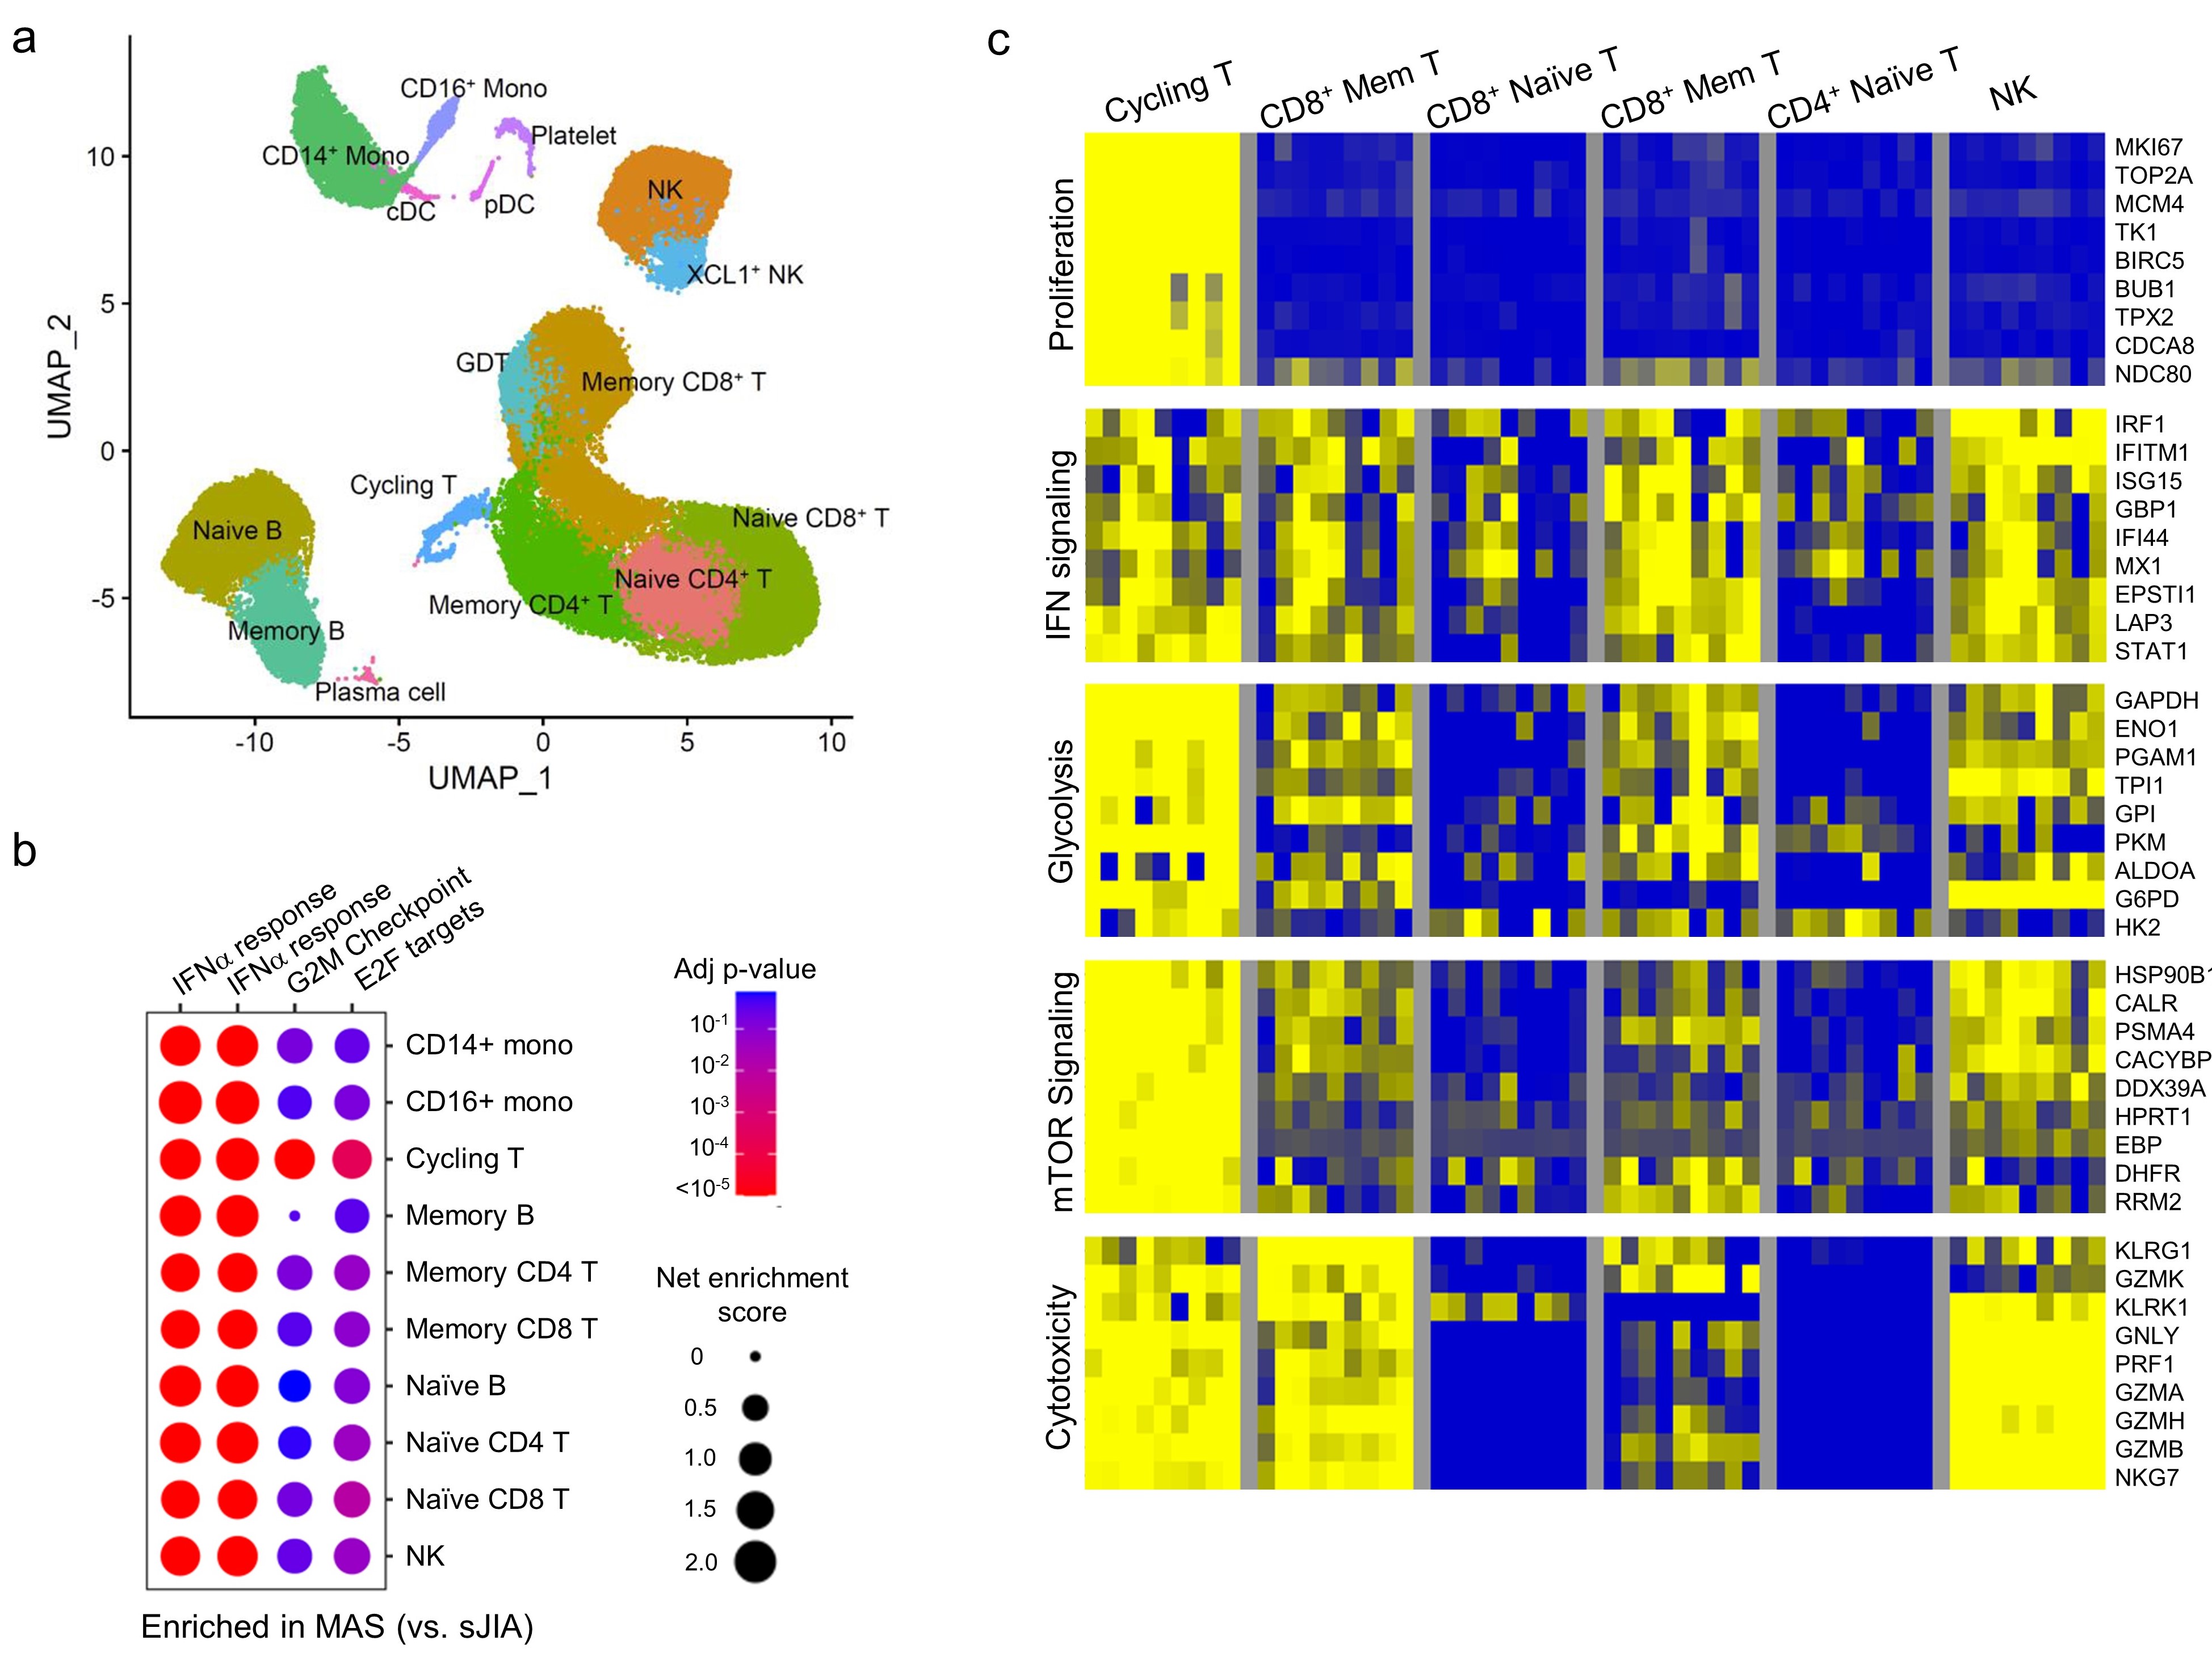 Figure 1. Single cell RNA-seq analysis of PBMCs from patients with sJIA with or without MAS. a) Uniform Manifold Approximation and Projection (UMAP) and annotation of immune cell populations. b) cluster plot of gene set enrichment analysis comparing the gene signatures of IFN-I, IFN-I and cell proliferation (G2M checkpoint and E2F targets). C) heatmap comparison of gene signatures across different lymphocyte populations in patients with sJIA-associated MAS.
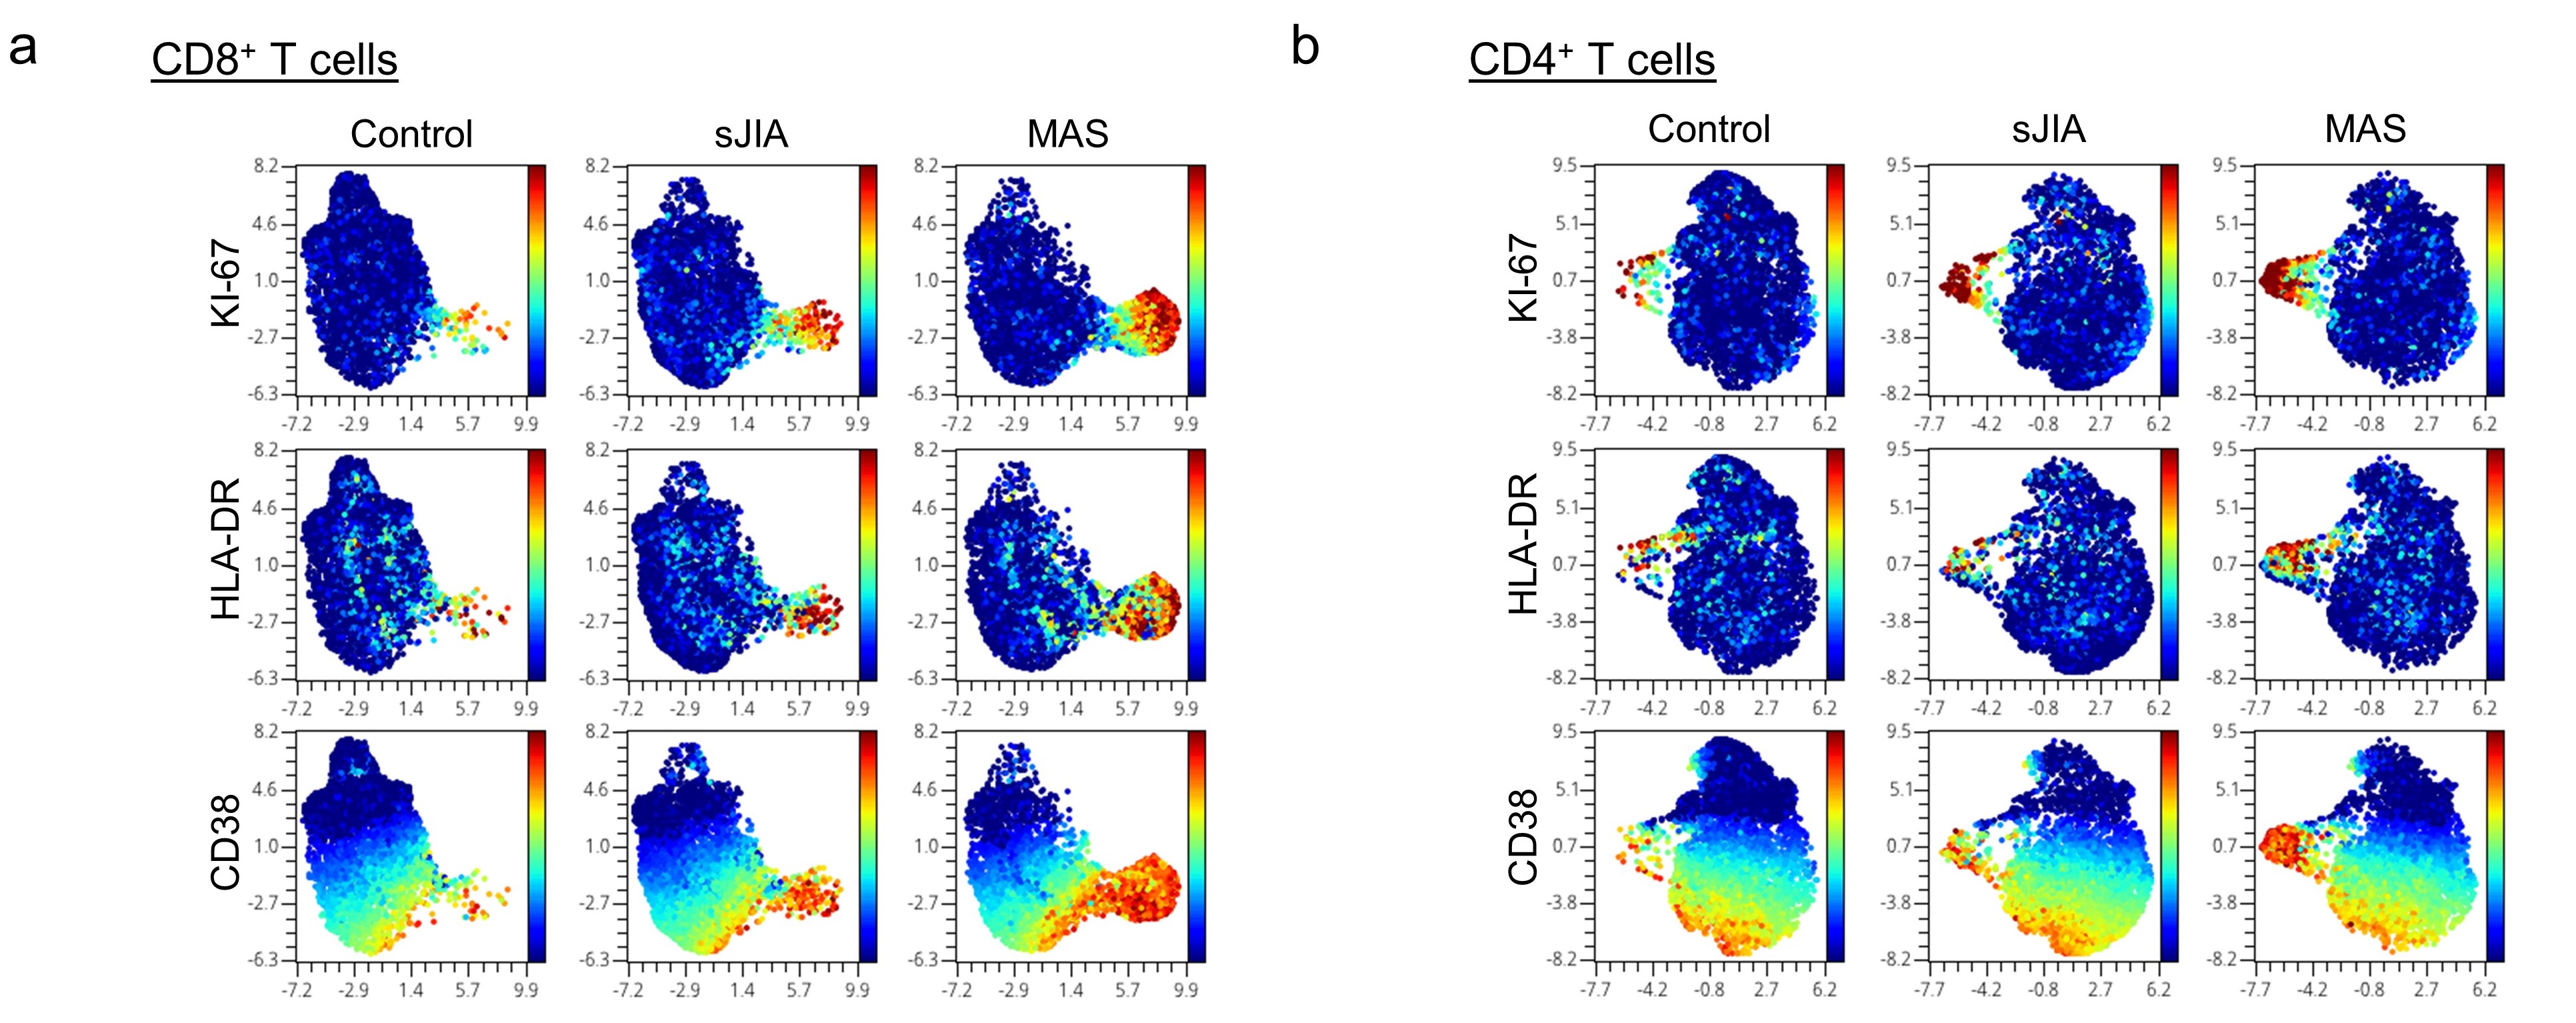 Figure 2. UMAP display of mass cytometry analysis comparing PBMCs from healthy controls and patients with sJIA with or without MAS. Color denotes the expression of KI-67, HLA-DR and CD38) on a) CD8+ T cells and b) CD4+ T cells.
 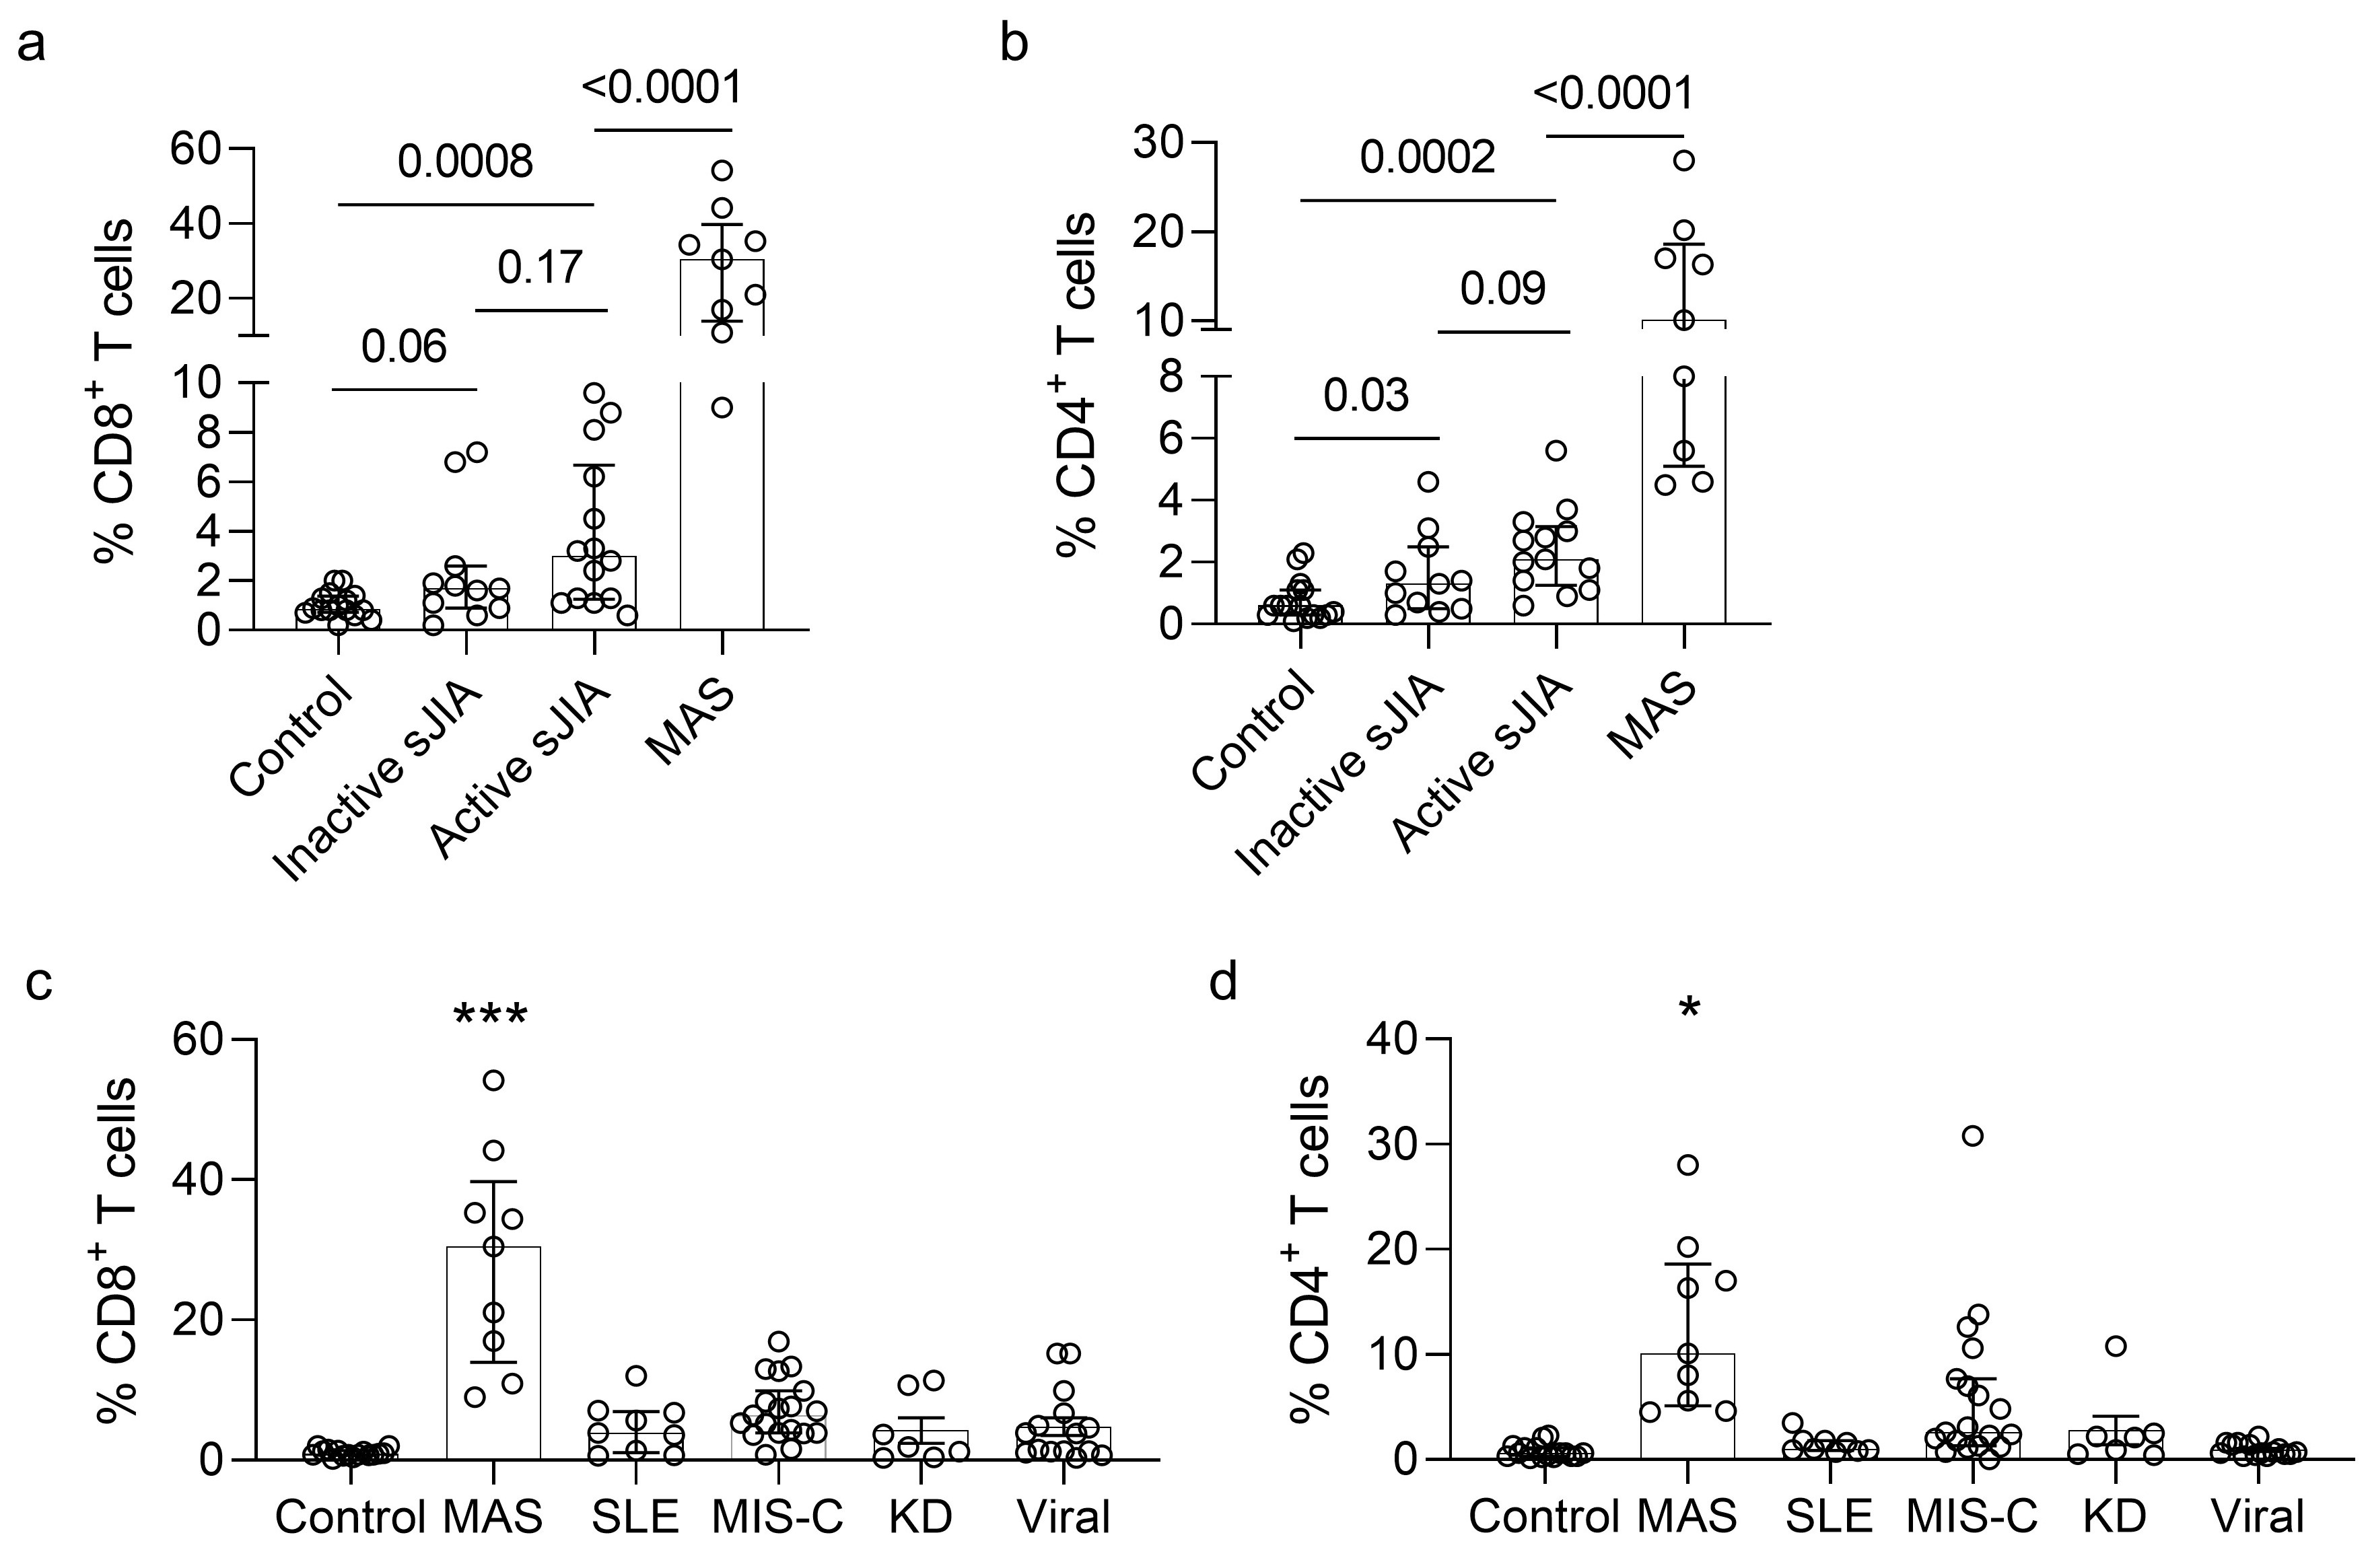 Figure 2. Quantification of cycling T cells in sJIA and other pediatric inflammatory diseases. a) Quantification of CD8+CD38+HLA-DR+ and b) CD4+CD38+HLA-DR+ T cells in healthy controls and patients with inactive sJIA, active sJIA without MAS, and active sJIA with MAS. c) Comparison of CD8+CD38+HLA-DR+ and d) CD4+CD38+HLA-DR+ T cells in healthy controls and patients with MAS, MIS-C, SLE, KD, and acute viral infections. * p < 0.05; *** p < 0.001