
Abstract Session
Geoffrey Stephens, PhD
Exagen, Inc.
Vista, CA, United States
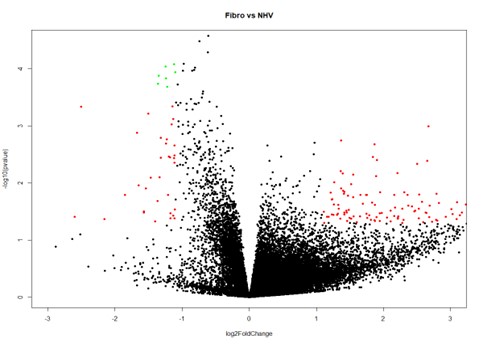 Figure 1. Volcano plot illustrating RNA transcripts differentially expressed (log2-fold changes) between 14 normal health donors (NHVs; x-axis) and 26 fibromyalgia (fibro; y-axis) patients. Red colored dots indicate transcripts that were differentially expressed with p-values < 0.05, and green dots indicate those with p-adjusted values of < 0.1.