
Abstract Session
.jpg "Jemima Albayda, MD, RhMSUS photo")
Jemima Albayda, MD, RhMSUS
Johns Hopkins University
Baltimore, MD, United States
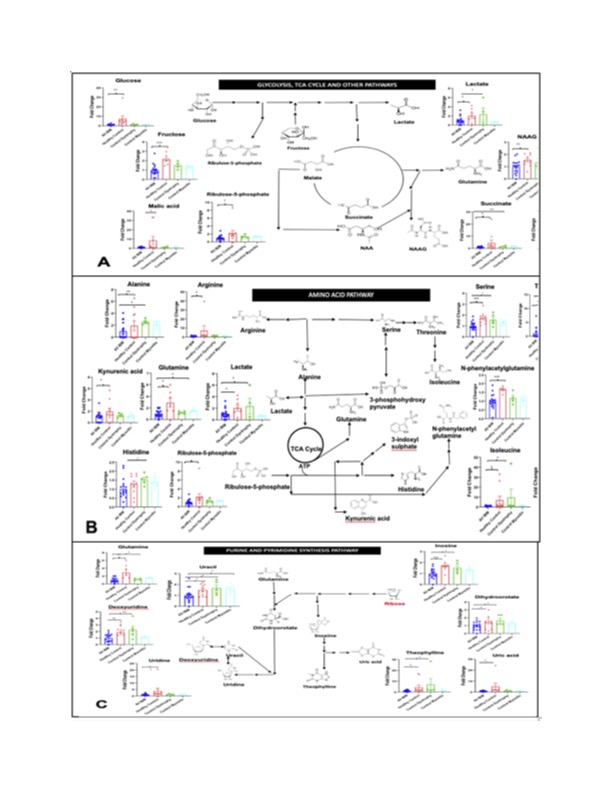 Fig. 1 Downregulation of energy pathways in IBM. Serum metabolomics comparing 17 IBM patients (blue) with age matched 8 healthy (red), 5 dystrophy (green) and 5 myositis (aqua) controls showing the statistically significantly decreased metabolites involved in glycolysis/TCA cycle (A), amino acid pathways (B), and nucleotide synthesis (C). Data are shown as fold change as compared to IBM. * indicates p < 0.05, ** indicates p < 0.01, *** indicates p < 0.001.
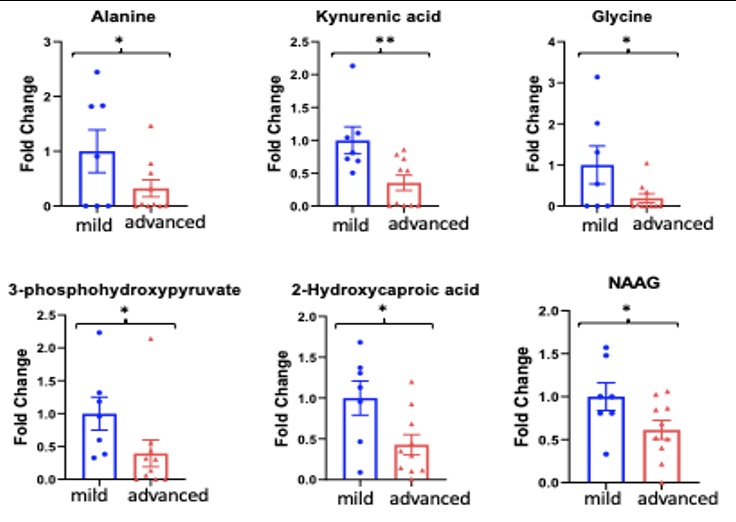 Fig. 2. Serum metabolomics comparing 7 mild IBM (independent with ambulation) with 10 severe IBM (requiring use of assistive devices) patients. Six significantly downregulated metabolites were seen in the advanced group when compared to the mild group. Results shown in fold change.* indicates p < 0.05, ** indicates p < 0.01
 Fig. 3. Serum metabolomics comparisons between longitudinal samples for representative metabolites in 4 patients. A- 74 y/o F, 7year interval between samples; B- 70 y/o M, 5-year interval between samples; C- 55 y/o F, 2-year interval between samples; D- 70 y/o M, 7-year interval between samples