
Abstract Session
Timothy Wilson, MD
Thomas Jefferson University
Philadelphia, PA, United States
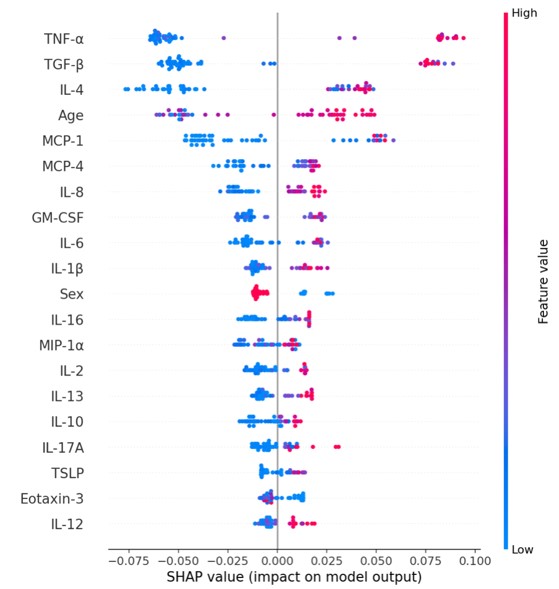 Figure 1. Sputum cytokines in RA-ILD. Top 20 cytokines/chemokines ranked from most (top) to least (bottom) impactful in predicting whether a subject is RA-no-ILD vs RA-ILD . Each data point represents one subject. Shapley Additive Explanation (SHAP) value depicts the probability of the impact on the model’s prediction. The feature value depicts whether a variable has a low, medium or high value.
 .jpg) Figure 3. Correlation of cytokine levels with MUC5B promoter variant. MUC5B genotype (“G” - wild type allele, “T” – minor, at-risk allele) correlated with sputum levels of TGF-β1 (panel A), IL-4 (panel B), MCP-1 (panel C), and TNF-α (panel D) in RA-ILD subjects (n=16). P-value based on nonparametric Mann-Whitney U testing.
Figure 3. Correlation of cytokine levels with MUC5B promoter variant. MUC5B genotype (“G” - wild type allele, “T” – minor, at-risk allele) correlated with sputum levels of TGF-β1 (panel A), IL-4 (panel B), MCP-1 (panel C), and TNF-α (panel D) in RA-ILD subjects (n=16). P-value based on nonparametric Mann-Whitney U testing.