
Poster Session B
Systemic lupus erythematosus (SLE)
Audrey Hagiwara, MD
Cedars-Sinai Medical Center
Los Angeles, CA, United States
.jpg) Table: Demographic and Characteristics of SLE Participants
Table: Demographic and Characteristics of SLE Participants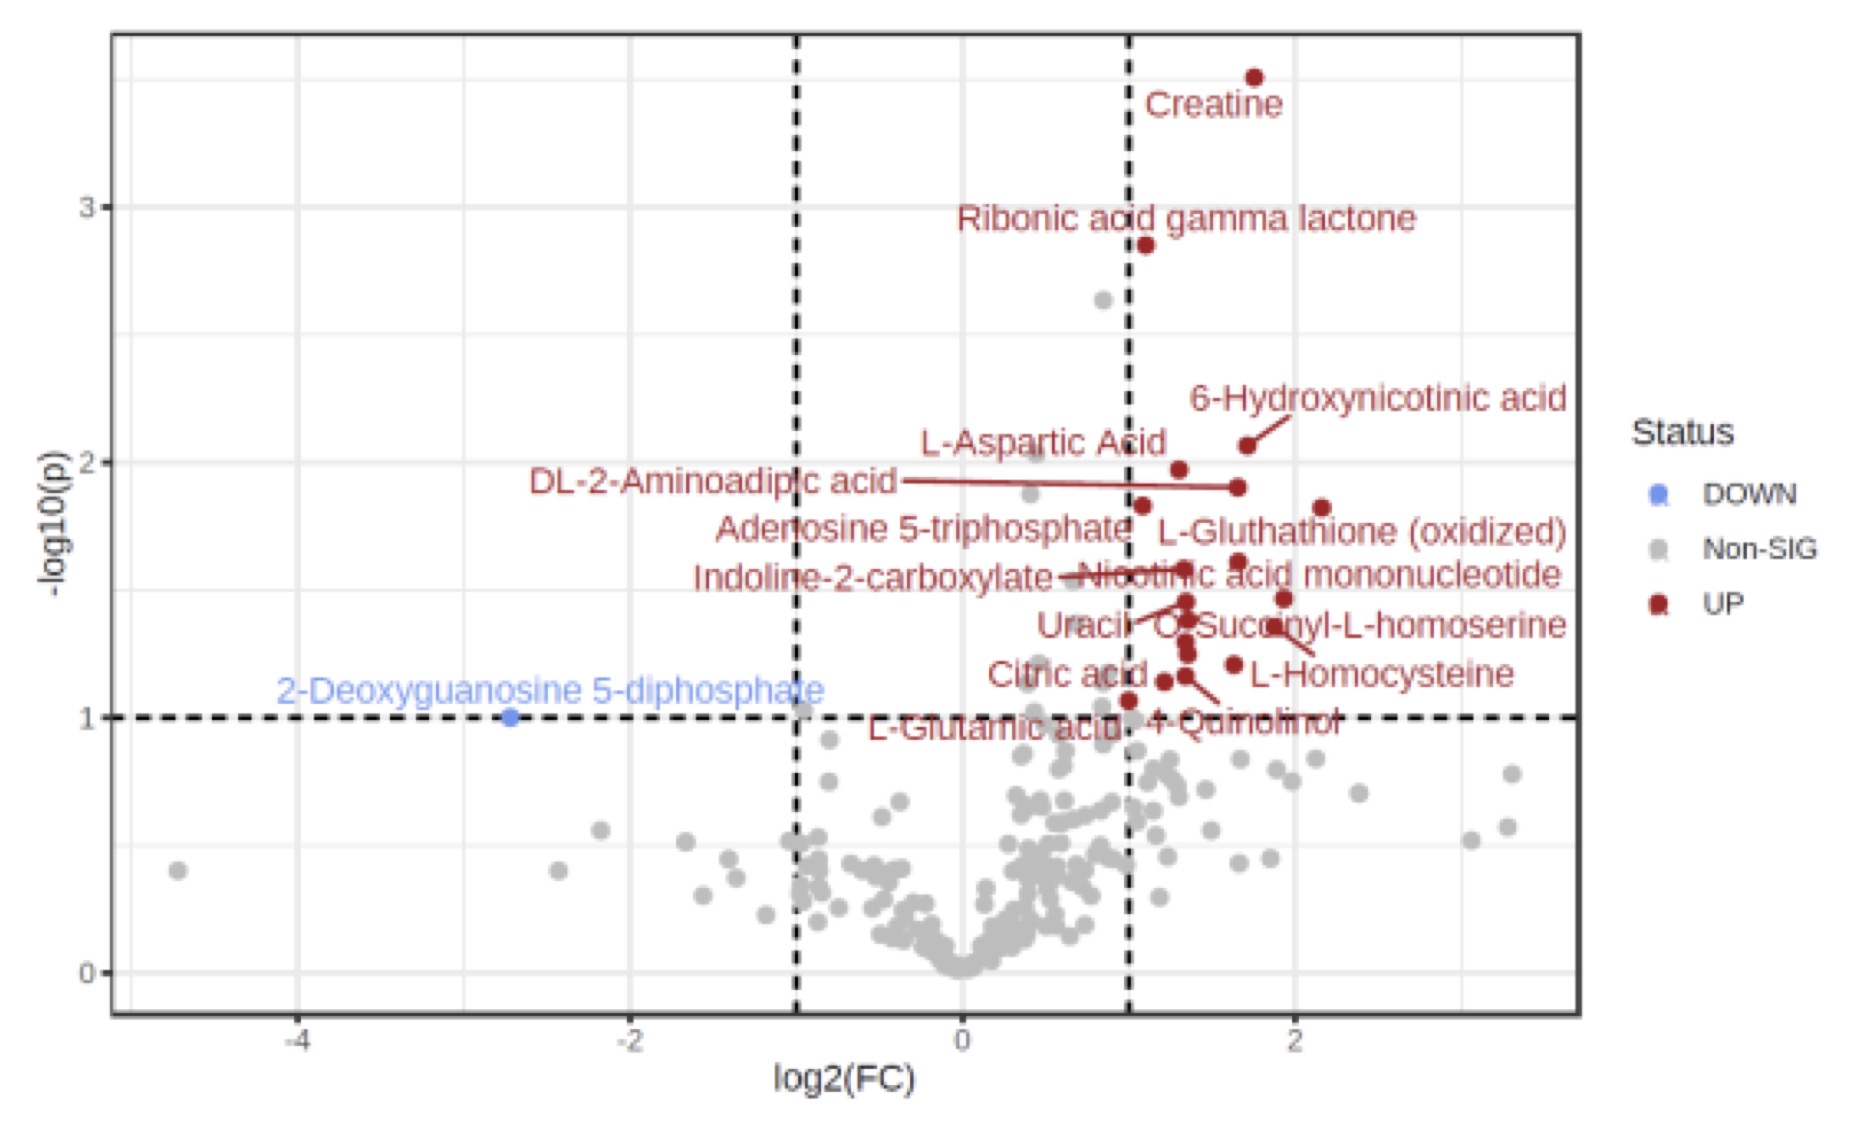 Figure 1: Important features selected by volcano plot with fold change threshold (x) 2 and t-tests
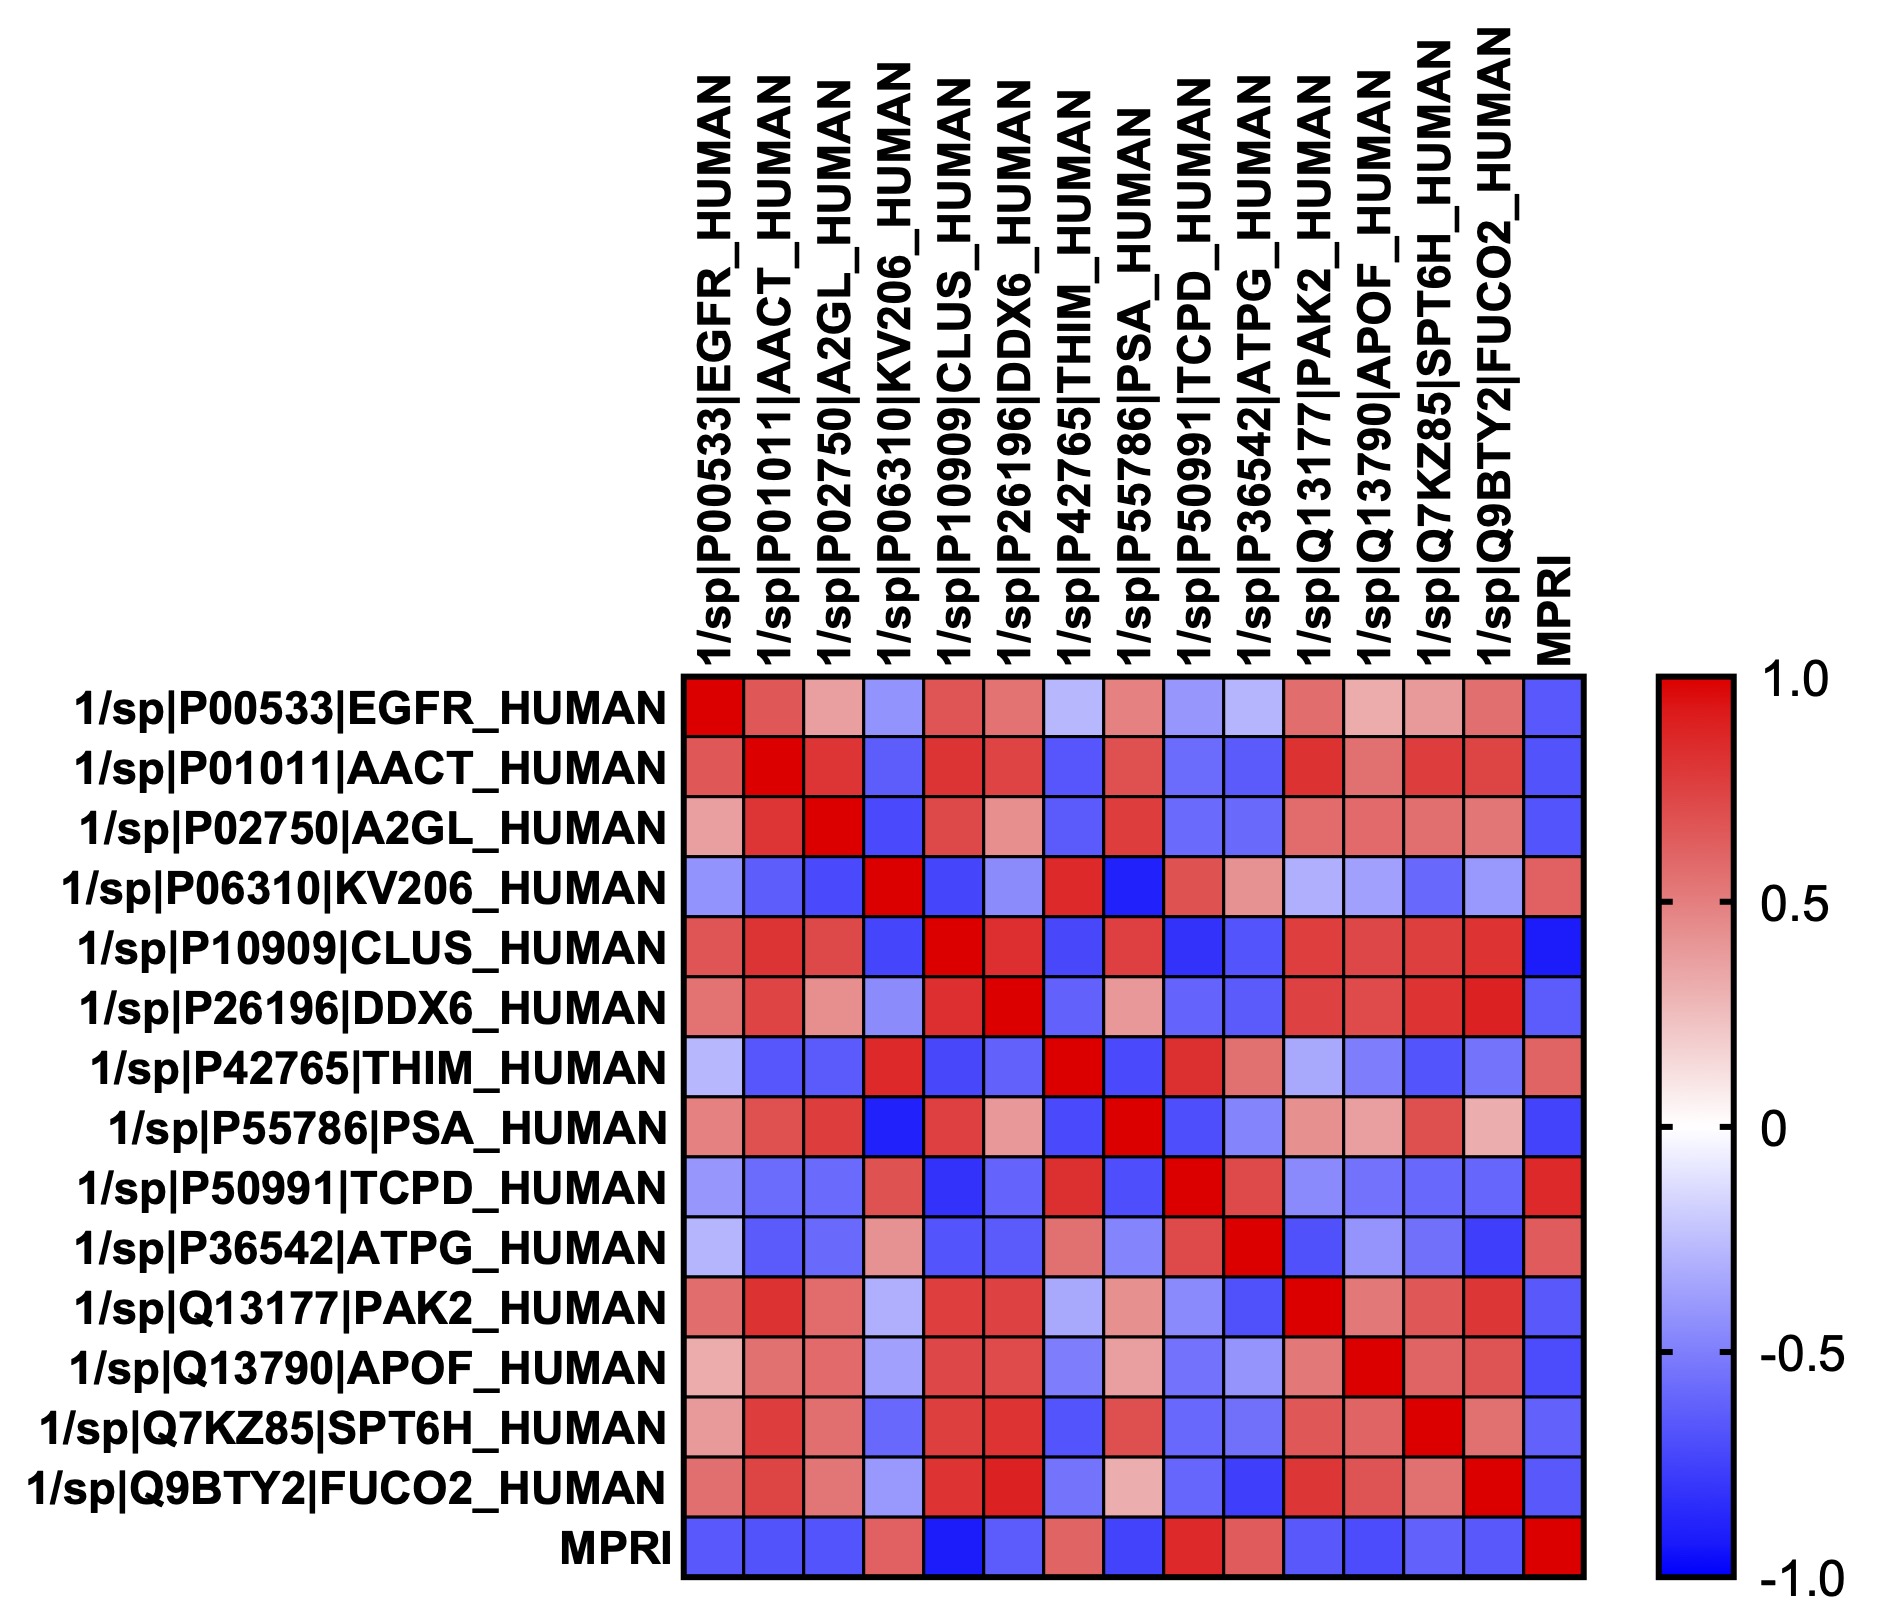 Figure 2: Heatmap of Pearson’s correlation coefficient between each serum protein found to be significantly correlated with MPRI. The correlation between each of the proteins with MPRI is down on the bottom row. In each case, p < 0.05. Epidermal growth factor receptor (EGFR); Alpha-1-antichymotrypsin (AACT); Leucine rich alpha-2 glycoprotein 1 (A2GL); Ig kappa chain V-II region (KV206); Clusterin (CLUS); ATP-dependent RNA helicase (DDX6); Mitochondrial 3-ketoacyl-CoA thiolase (THIM); Puromycin-sensitive aminopeptidase (PSA); T-complex protein 1 subunit delta (TCPD); Mitochondrial ATP synthase subunit gamma (ATPG); Serine/threonine-protein kinase (PAK2); Apolipoprotein F (APOF); Transcription elongation factor SPT6 (SPT6H); Plasma alpha-L-fucosidase (FUCO2).