
Poster Session B
Antiphospholipid Syndrome
NaveenKumar Somanathapura, PhD
University of Mysore, Karnataka, India
Ann arbor, MI, United States
.jpg) Figure 1: The effect of NETosis inhibitors on APS IgG-mediated NETosis and lipid peroxidation. PMA- (20 nM) or APS IgG- (50 µg/mL) induced NETosis was compared with untreated (*) or stimulated (#) neutrophils. C-D, PMA- or APS IgG-induced lipid peroxidation was compared with untreated (*) or stimulated (#) neutrophils. Representative histograms are also shown. ****p < 0.0001, #p < 0.05, ###p < 0.001, and ####p < 0.0001. Analysis was with one-way ANOVA followed by Tukey's multiple-comparison test; ns= not significant.
Figure 1: The effect of NETosis inhibitors on APS IgG-mediated NETosis and lipid peroxidation. PMA- (20 nM) or APS IgG- (50 µg/mL) induced NETosis was compared with untreated (*) or stimulated (#) neutrophils. C-D, PMA- or APS IgG-induced lipid peroxidation was compared with untreated (*) or stimulated (#) neutrophils. Representative histograms are also shown. ****p < 0.0001, #p < 0.05, ###p < 0.001, and ####p < 0.0001. Analysis was with one-way ANOVA followed by Tukey's multiple-comparison test; ns= not significant..jpg) Figure 2: The effect of lipid peroxidation inhibitors on APS IgG-mediated NETosis and lipid peroxidation. A-B, PMA- (20 nM) or APS IgG- (50 µg/mL) induced NETosis was compared with untreated (*) or stimulated (#) neutrophils. C-D, PMA- or APS IgG-induced lipid peroxidation was compared with untreated (*) or stimulated (#) neutrophils. ****p < 0.0001, #p < 0.05, ###p < 0.001, and ####p < 0.0001. Analysis was with one-way ANOVA followed by Tukey's multiple-comparison test; ns= not significant.
Figure 2: The effect of lipid peroxidation inhibitors on APS IgG-mediated NETosis and lipid peroxidation. A-B, PMA- (20 nM) or APS IgG- (50 µg/mL) induced NETosis was compared with untreated (*) or stimulated (#) neutrophils. C-D, PMA- or APS IgG-induced lipid peroxidation was compared with untreated (*) or stimulated (#) neutrophils. ****p < 0.0001, #p < 0.05, ###p < 0.001, and ####p < 0.0001. Analysis was with one-way ANOVA followed by Tukey's multiple-comparison test; ns= not significant.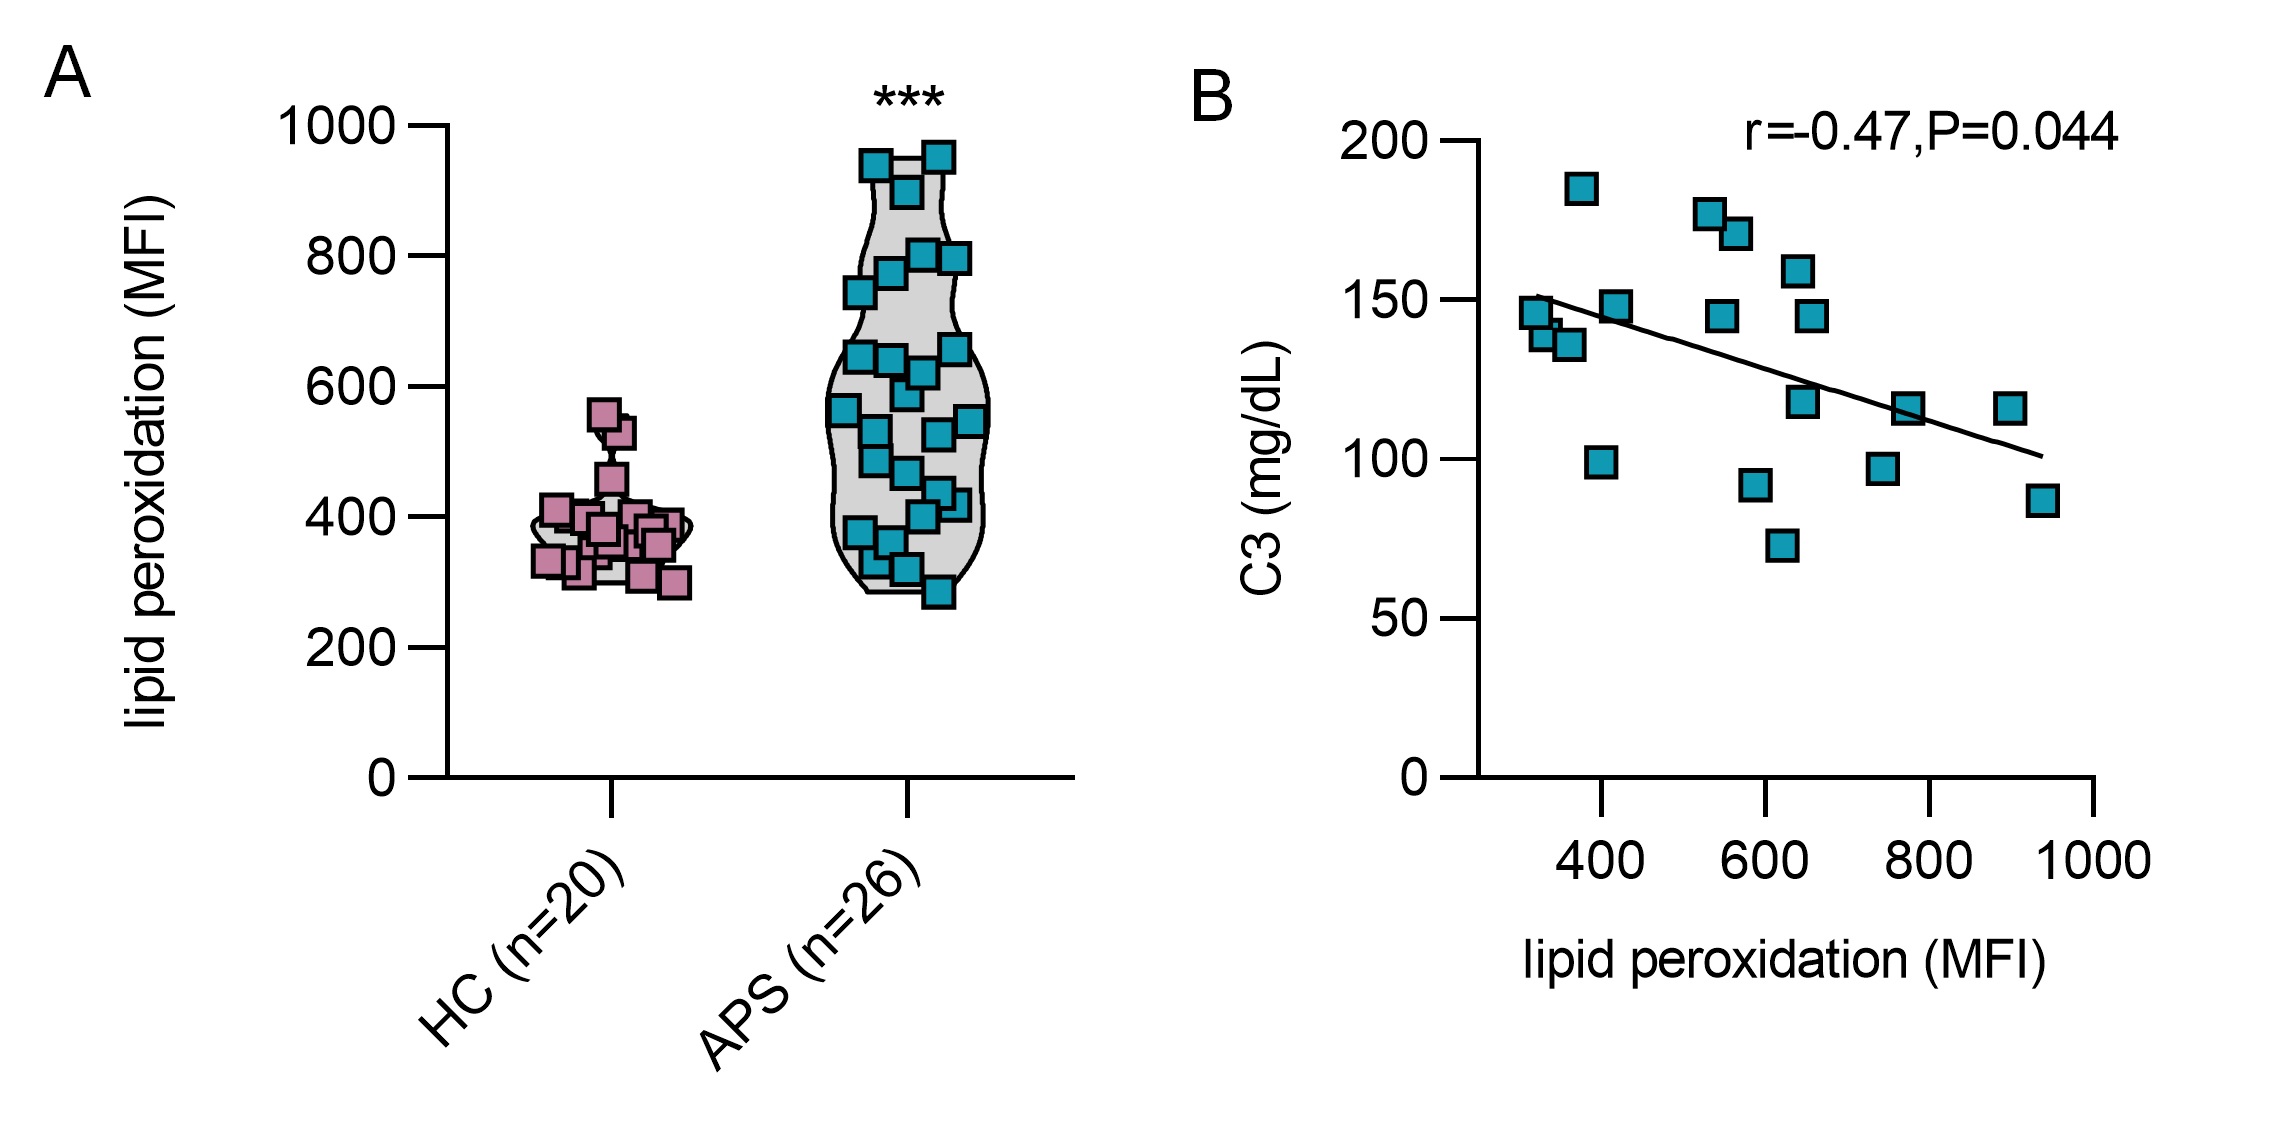 Figure 3: Neutrophil lipid peroxidation in patients with primary APS. Neutrophil isolated from patients with primary APS (n=26) and healthy control (HC) (n=20) were incubated with BODIPY C11 (2 µM) for 15 mins and lipid peroxidation was assessed by flow cytometry. A, Lipid peroxidation was quantified as mean fluorescence intensity (MFI), and groups were compared by Mann-Whitney U test; ***p < 0.001. B, Correlation between neutrophil lipid peroxidation (MFI) and circulating complement C3 was determined by Spearman’s method.