
Ignite Talk
John Zent, BA
AMPEL BioSolutions LLC
Leesburg, VA, United States
Disclosure: Disclosure information not submitted.
.jpg)
.jpg) Figure 1. Raincloud plots showing differences in the distributions of physician disease activity measures between clusters. A, Clustering patients using whole-study ePRO means as inputs. B, Results using monthly ePRO means as clustering inputs. Asterisks indicate statistical significance calculated from two-sided Mann Whitney-U tests. *P < 0.05;**P < 0.01;***P < 0.001;****P < 0.0001.
Figure 1. Raincloud plots showing differences in the distributions of physician disease activity measures between clusters. A, Clustering patients using whole-study ePRO means as inputs. B, Results using monthly ePRO means as clustering inputs. Asterisks indicate statistical significance calculated from two-sided Mann Whitney-U tests. *P < 0.05;**P < 0.01;***P < 0.001;****P < 0.0001.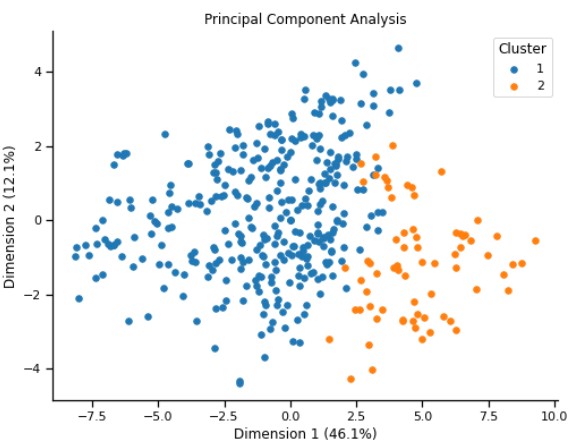 Figure 2. Hierarchical clustering of monthly PRO means reveals two groups. 408 total samples were prepared from the PROs of 62 patients collected over multiple months.