
Poster Session D
Crystal arthropathies
.png "Swamy Venuturupalli, MD photo")
Swamy Venuturupalli, MD
Cedars-Sinai Medical Center
Beverly Hills, CA, United States
.jpg) Figure 1: RNA was extracted from whole blood samples from patients with inter-critical gout (n=4), health controls (HC) (n=4) and patients with Rheumatoid Arthritis (RA) (n=6). Levels of gene expression where determined by qPCR and expression of genes in gout patients was relative to HC and RA patient levels. Data is pooled data from patients and HC samples. Statistical significance was determined by Student t test, with p < 0.05 being considered significant.
Figure 1: RNA was extracted from whole blood samples from patients with inter-critical gout (n=4), health controls (HC) (n=4) and patients with Rheumatoid Arthritis (RA) (n=6). Levels of gene expression where determined by qPCR and expression of genes in gout patients was relative to HC and RA patient levels. Data is pooled data from patients and HC samples. Statistical significance was determined by Student t test, with p < 0.05 being considered significant. 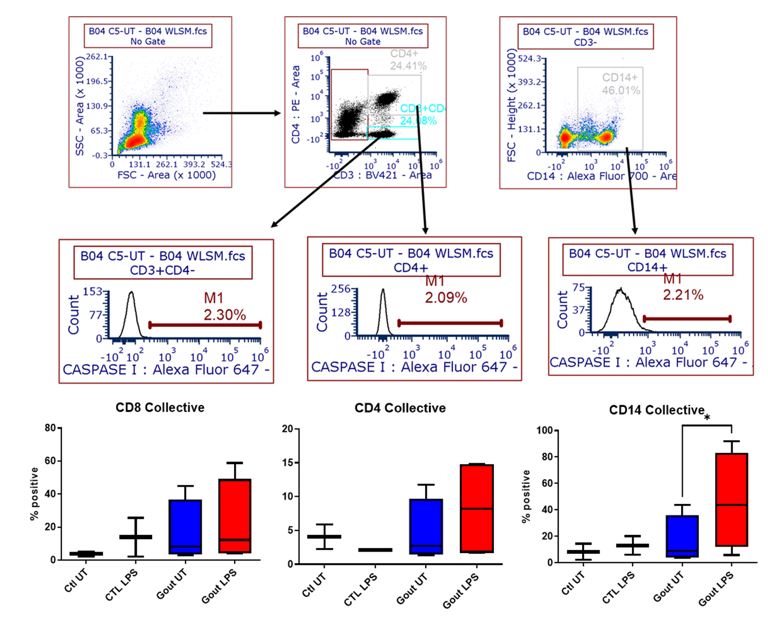 Figure 2: PBMCs from gout patients (n=4) were stained for surface markers (CD45, CD4, CD14) and caspase activity measured following LPS and nigercin priming. Representative schematic showing gating strategy and LPS-induced CASPASE-1 activity in CD4+, CD8+ and CD14+ cells (n=4), lower panel. Statistical significance was determined by one-way ANOVA, with p < 0.05 considered significant.
 .jpg) Figure 3: (A) CASPASE-1 expression was measured in synovial biopsies from RA (n=6) and gout patients (n=4) by qPCR; (B-C) synovial biopsies from gout patients (n=4) were digested, stained for surface markers (CD45, CD4, CD14) and caspase activity measured. (B) Caspase activity compared in CD45-stromal cells from gout (n=4) and RA (n=2) synovial biopsies; (C) Representative schematic showing gating strategy and LPS-induced caspase-1 activity (red line) in the CD45- stromal cells, CD3+ T cells, CD14+ monocytes and CD3-CD14-immune populations.
Figure 3: (A) CASPASE-1 expression was measured in synovial biopsies from RA (n=6) and gout patients (n=4) by qPCR; (B-C) synovial biopsies from gout patients (n=4) were digested, stained for surface markers (CD45, CD4, CD14) and caspase activity measured. (B) Caspase activity compared in CD45-stromal cells from gout (n=4) and RA (n=2) synovial biopsies; (C) Representative schematic showing gating strategy and LPS-induced caspase-1 activity (red line) in the CD45- stromal cells, CD3+ T cells, CD14+ monocytes and CD3-CD14-immune populations.