
Poster Session A
Diversity, inclusion and racial disparities
Alissa Chandler, MD, BS
Washington University
St. Louis, MO, United States
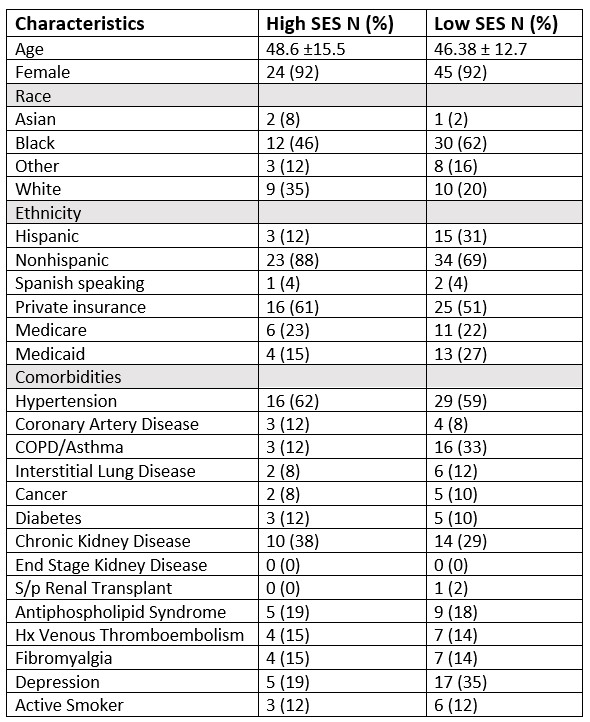 Table 1: Demographics and comorbidities of each group.
 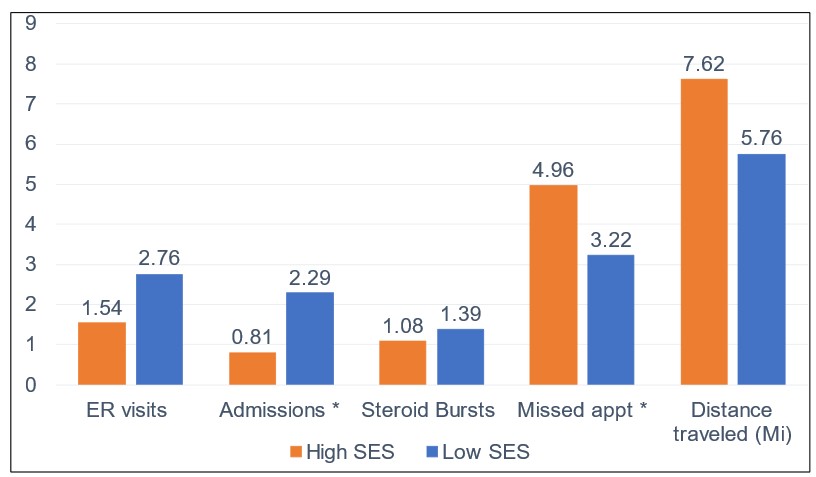 Figure 1: Mean values of primary and secondary outcomes and comparison with T test. Mean (standard deviation) for high SES and low SES respectively: ER visits 1.54 (2.06), 2.76 (3.72), Admissions 0.81 (1.06), 2.29 (3.54), Steroid bursts 1.08 (2.04), 1.39 (1.53), Missed appt 4.96 (4.91), 3.22 (2.53), Distance 7.62 (6.02), 5.76 (5.35).