
Poster Session C
Rheumatoid arthritis (RA)
Monica Guma, MD, PhD
UCSD
La Jolla, CA, United States
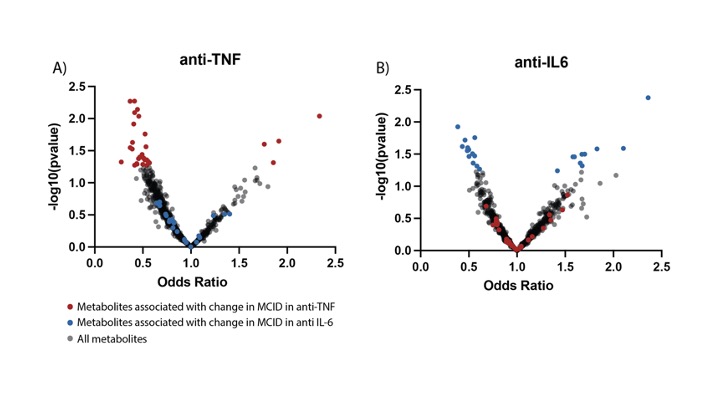 Figure 1.Volcano plots visualizing baseline metabolites associated with responders vs. non responders in a) anti-TNF and b) anti IL-6 therapy groups. Results are derived from multivariate logistic regression analysis of baseline metabolites and response to treatment categorized by MCID. Data plotted as the metabolite against its statistical significance, respectively reported as odds ratio (OR) and -log10(pvalue)
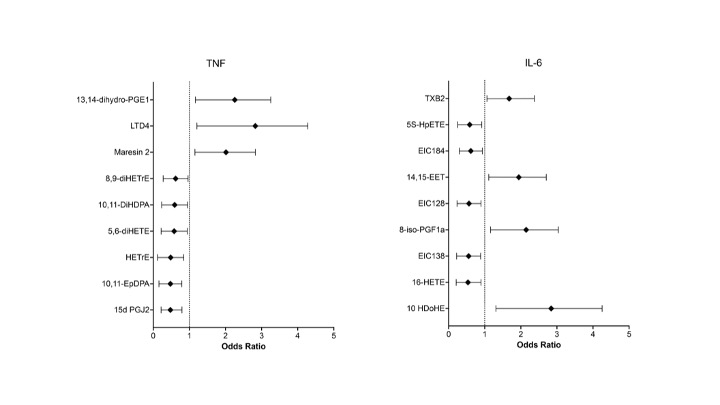 Figure 2. Forest plot visualizing baseline metabolites associated with responders vs. non responders in anti-TNF and anti-IL6 therapy groups. Results are derived from multivariate logistic regression analysis of baseline metabolites and response to treatment categorized by MCID in CDAI