
Poster Session C
Rheumatoid arthritis (RA)
Russell Ross, PhD
Sorrento Therapeutics
Sandy Springs, GA, United States
.jpg) Table 1: Baseline demographics and disease characteristics for first 7 patients. “Other RA Medications” column includes additional therapies patients were using at W0 (baseline) to treat RA; “Comorbidities” column includes ongoing medical conditions at W0; “Disease State” column represents disease activity at W0 (baseline), as measured by DAS28(CRP).
Table 1: Baseline demographics and disease characteristics for first 7 patients. “Other RA Medications” column includes additional therapies patients were using at W0 (baseline) to treat RA; “Comorbidities” column includes ongoing medical conditions at W0; “Disease State” column represents disease activity at W0 (baseline), as measured by DAS28(CRP).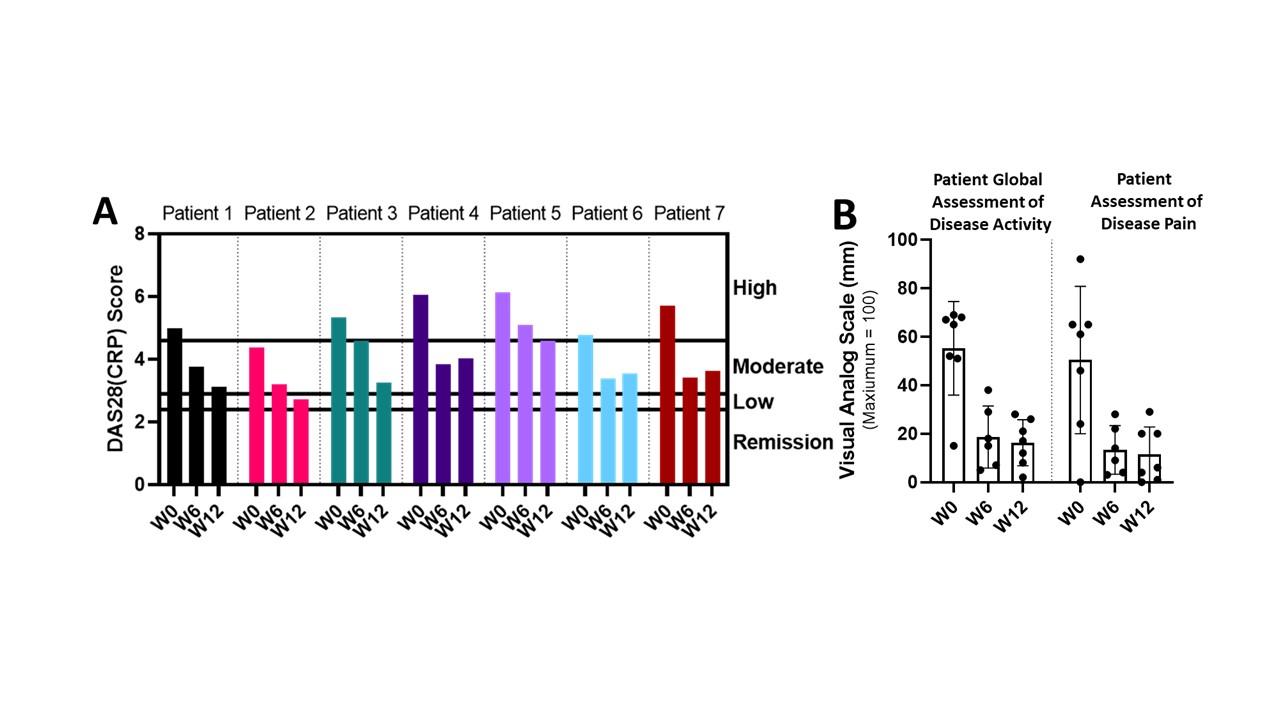 Figure 1: Disease scoring and metrics in patients treated using lymphatic delivery of etanercept. A) DAS28(CRP) levels at W0 (baseline), W6, and W12, and B) Left) Patient Global Assessment of Disease Activity, Right) Patient Assessment of Disease Pain. Data are represented as mean ± SE (SE is the standard error).
 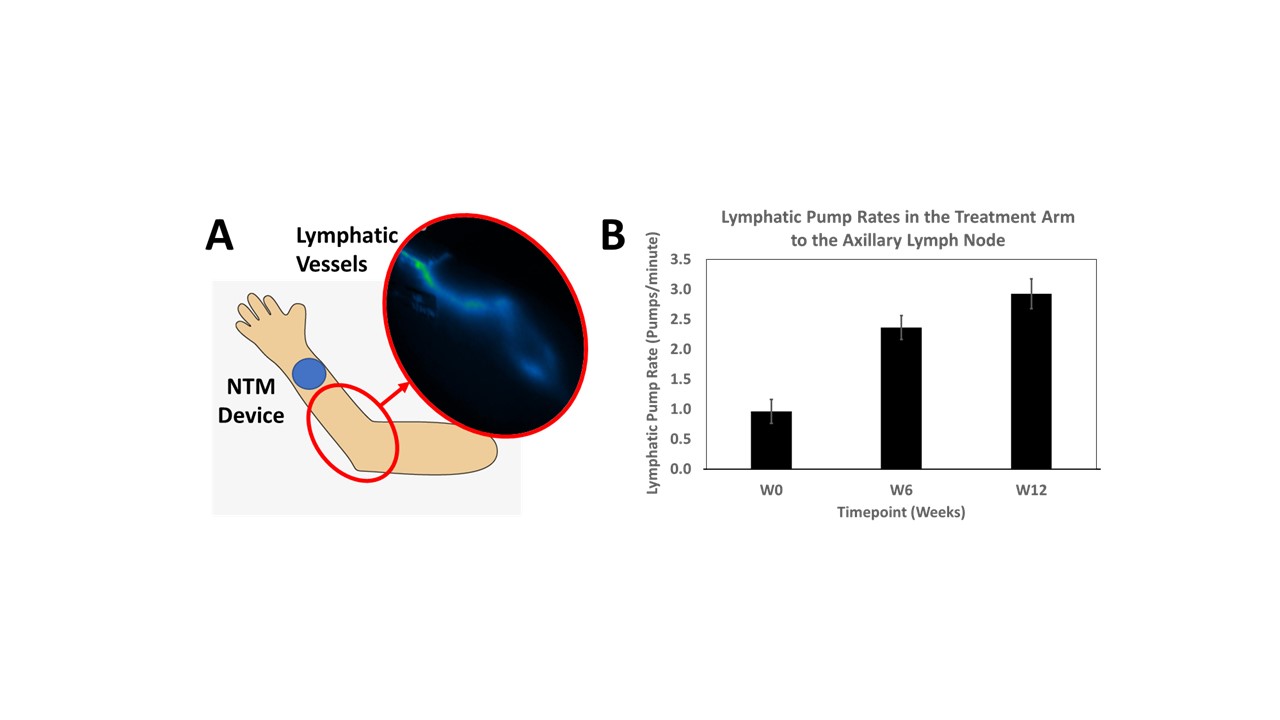 Figure 2: Improvements in lymphatic function from week 0 (W0) to 12 (W12) from lymphatic delivery of etanercept. A) Shows the nanotopography-microneedle (NTM) device dosing location on the patient and where the lymphatic vessels were imaged with indocyanine green dye. B) Comparison of lymphatic pump rates at W0 (baseline), 6 weeks (W6) and 12 weeks (W12) dosing. Data is presented as mean ± SE (SE is the standard error).