
Poster Session C
Epidemiology, health policy and outcomes
Catherine Bingham, MD
Penn State Children's Hospital
Hershey, PA, United States
.jpg) Figure 1: Y axis represents mean score (disease activity by cJADAS10 and AJC) and percent of patients who achieve the measure (inactive or LDA, and Clinical Inactive Disease).
Figure 1: Y axis represents mean score (disease activity by cJADAS10 and AJC) and percent of patients who achieve the measure (inactive or LDA, and Clinical Inactive Disease)..jpg) Figure 2: Y axis represents mean PtGA score and percent of patients who achieve the measure (optimal physical function, no or mild pain, and PtGA
Figure 2: Y axis represents mean PtGA score and percent of patients who achieve the measure (optimal physical function, no or mild pain, and PtGA 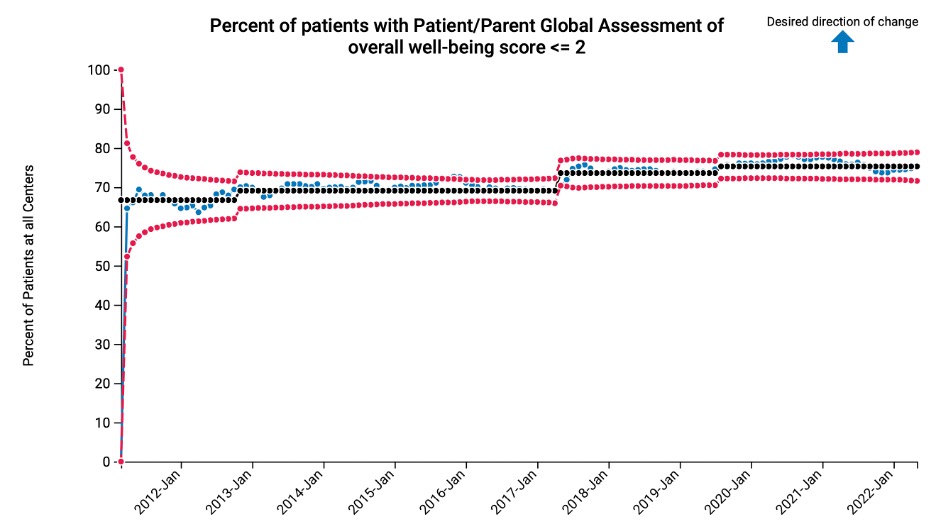 Figure 3: Blue dotted line=PR-COIN aggregate performance; Black dotted line=mean; Red dotted lines=control limits (+/-3 standard error of mean)