
Poster Session A
Vasculitis
Lien Moreel, MD
UZ Leuven
Leuven, Belgium
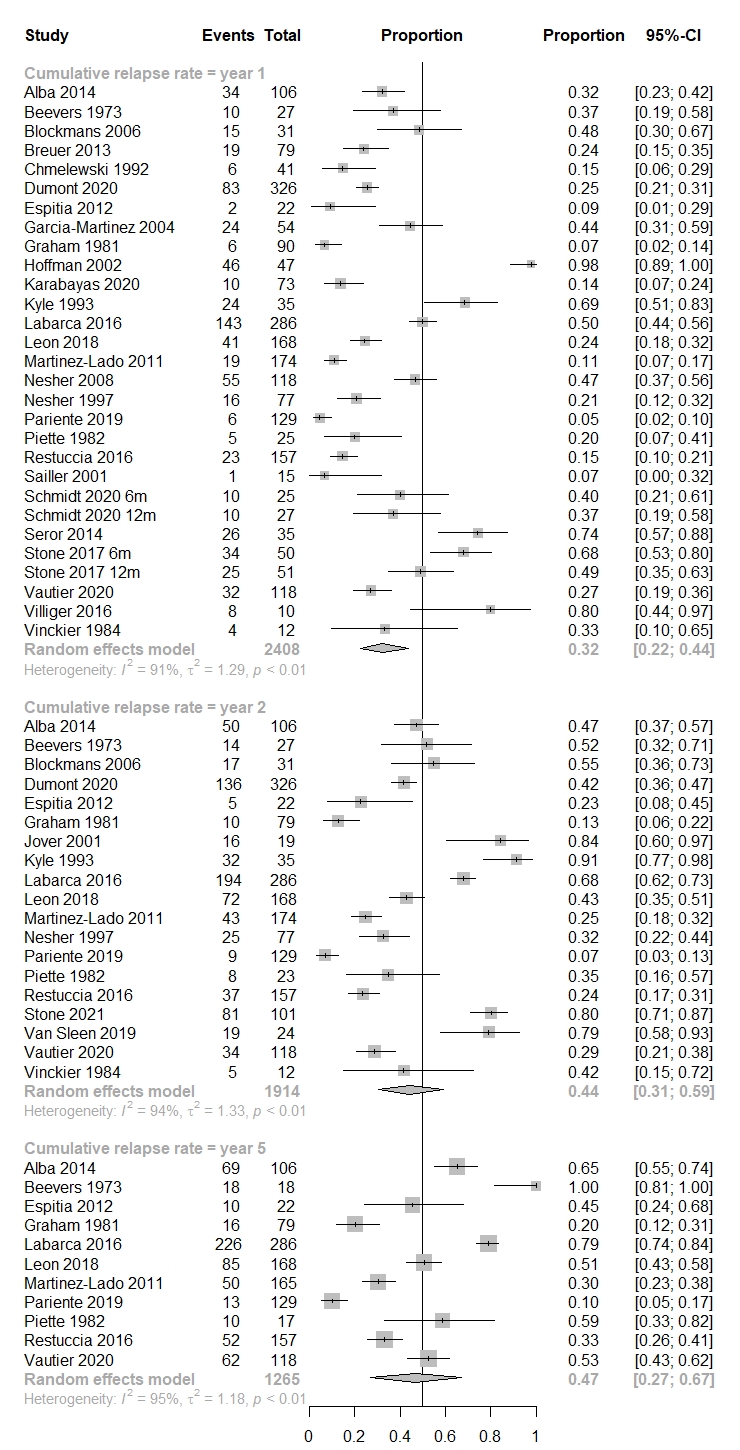 Figure 1: Forest plot of the cumulative relapse rate of first relapse at year 1, 2 and 5 after treatment initiation.
 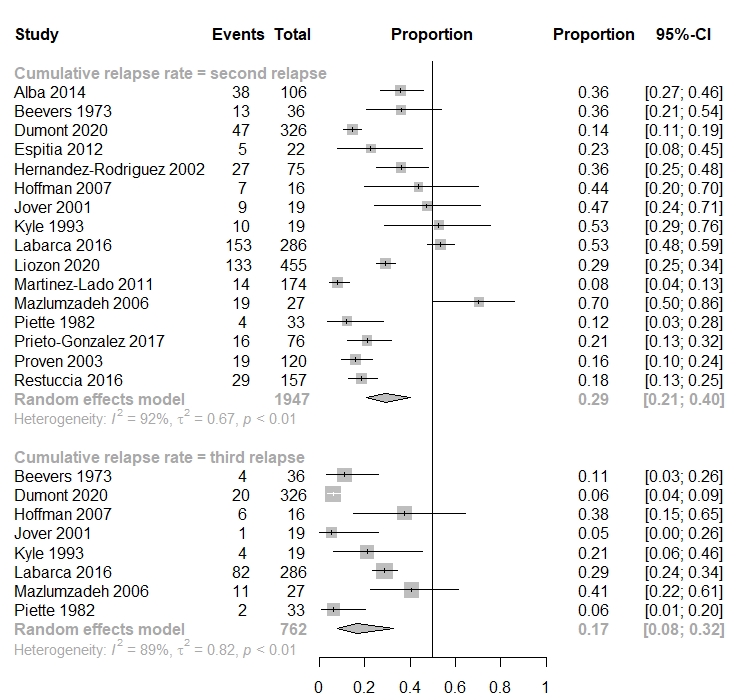 Figure 2: Forest plot of the cumulative relapse rate of second and third relapse
 .jpg) Figure 3: Forest plot of predictors of relapse A. Binary predictors B. Continuous predictors
Figure 3: Forest plot of predictors of relapse A. Binary predictors B. Continuous predictors