
Poster Session A
Vasculitis
Despoina Michailidou, MD
University of Washington
Seattle, WA, United States
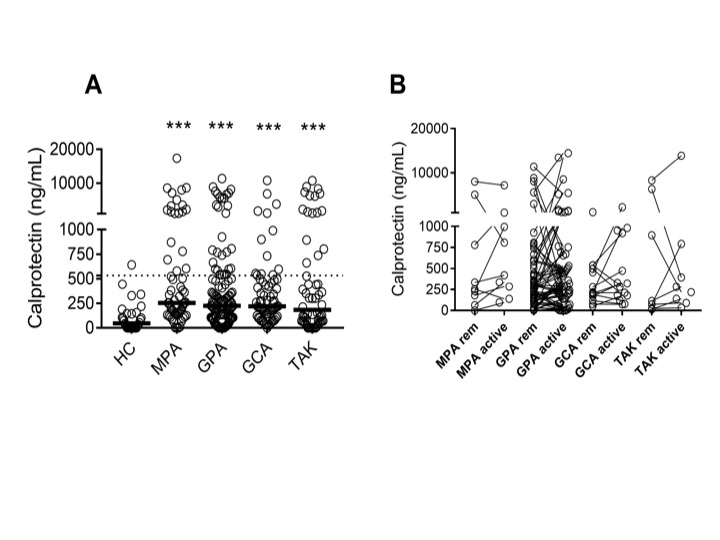 Figure 1. Levels of neutrophil activation marker calprotectin in patients with AAV and LVV. Plasma levels of (A) calprotectin were measured by ELISA in healthy controls (HC), and patients with microscopic polyangiitis (MPA), granulomatosis with polyangiitis (GPA), giant cell arteritis (GCA) and Takayasu’s arteritis (TAK) in remission. Plasma levels of (B) calprotectin were related to disease activity in patients in remission (rem) and matching patients with active disease (active) as assessed by physician global assessment (PGA) in MPA, GPA, GCA and TAK. Statistical analyses were done using Mann-Whitney U test, (A), and Wilcoxon signed-rank test (B) with * p < 0.05, **p < 0.01, ***p < 0.001. Unless otherwise indicated, all analyses are compared to healthy controls. Each circle represents an individual sample, with the bar representing the median of the group. The dotted line represents the 95th percentile of the HC.
 Figure 2. Levels of N formyl methionine peptides (fMET) and activation of neutrophils via its receptor formyl peptide receptor 1 (FPR1) in patients with AAV and LVV. Levels of (A) fMET were analyzed by ELISA in healthy controls (HC,) and patients with MPA, GPA, GCA, and TAK in remission. Neutrophils from a healthy donor (B) were incubated with plasma from HC or patients with vasculitis (Vasc) in presence or absence of Cyclosporine H (CsH) that is a selective FPR1 inhibitor and analyzed for reactive oxygen species (ROS) induction using flow cytometry.
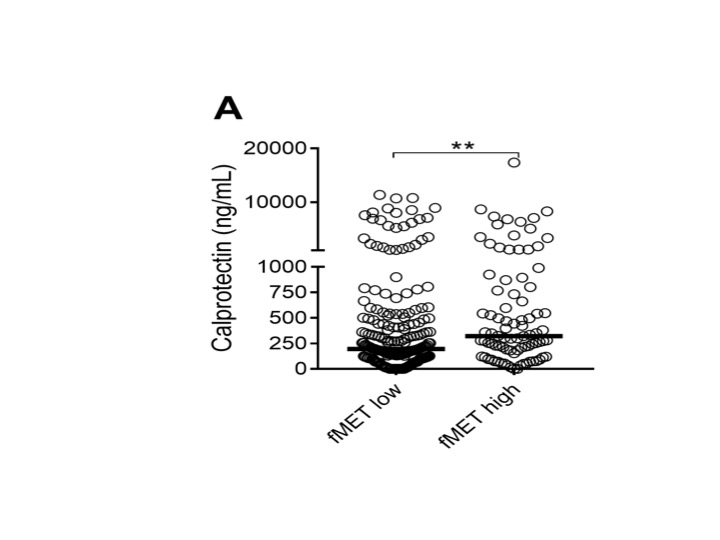 Figure 3. fMET-mediated release of calprotectin. Comparison of plasma levels of calprotectin in patients with either high or low levels of fMET, as determined by the 95th percentile of HC. Statistical analyses were done using Mann-Whitney U test (A), with * p < 0.05, **p < 0.01. Each circle represents an individual sample, with the bar representing the median of the group.