
Poster Session A
Vasculitis
Lisa Christ, MD
Inselspital, University Bern, Switzerland
Bern, Switzerland
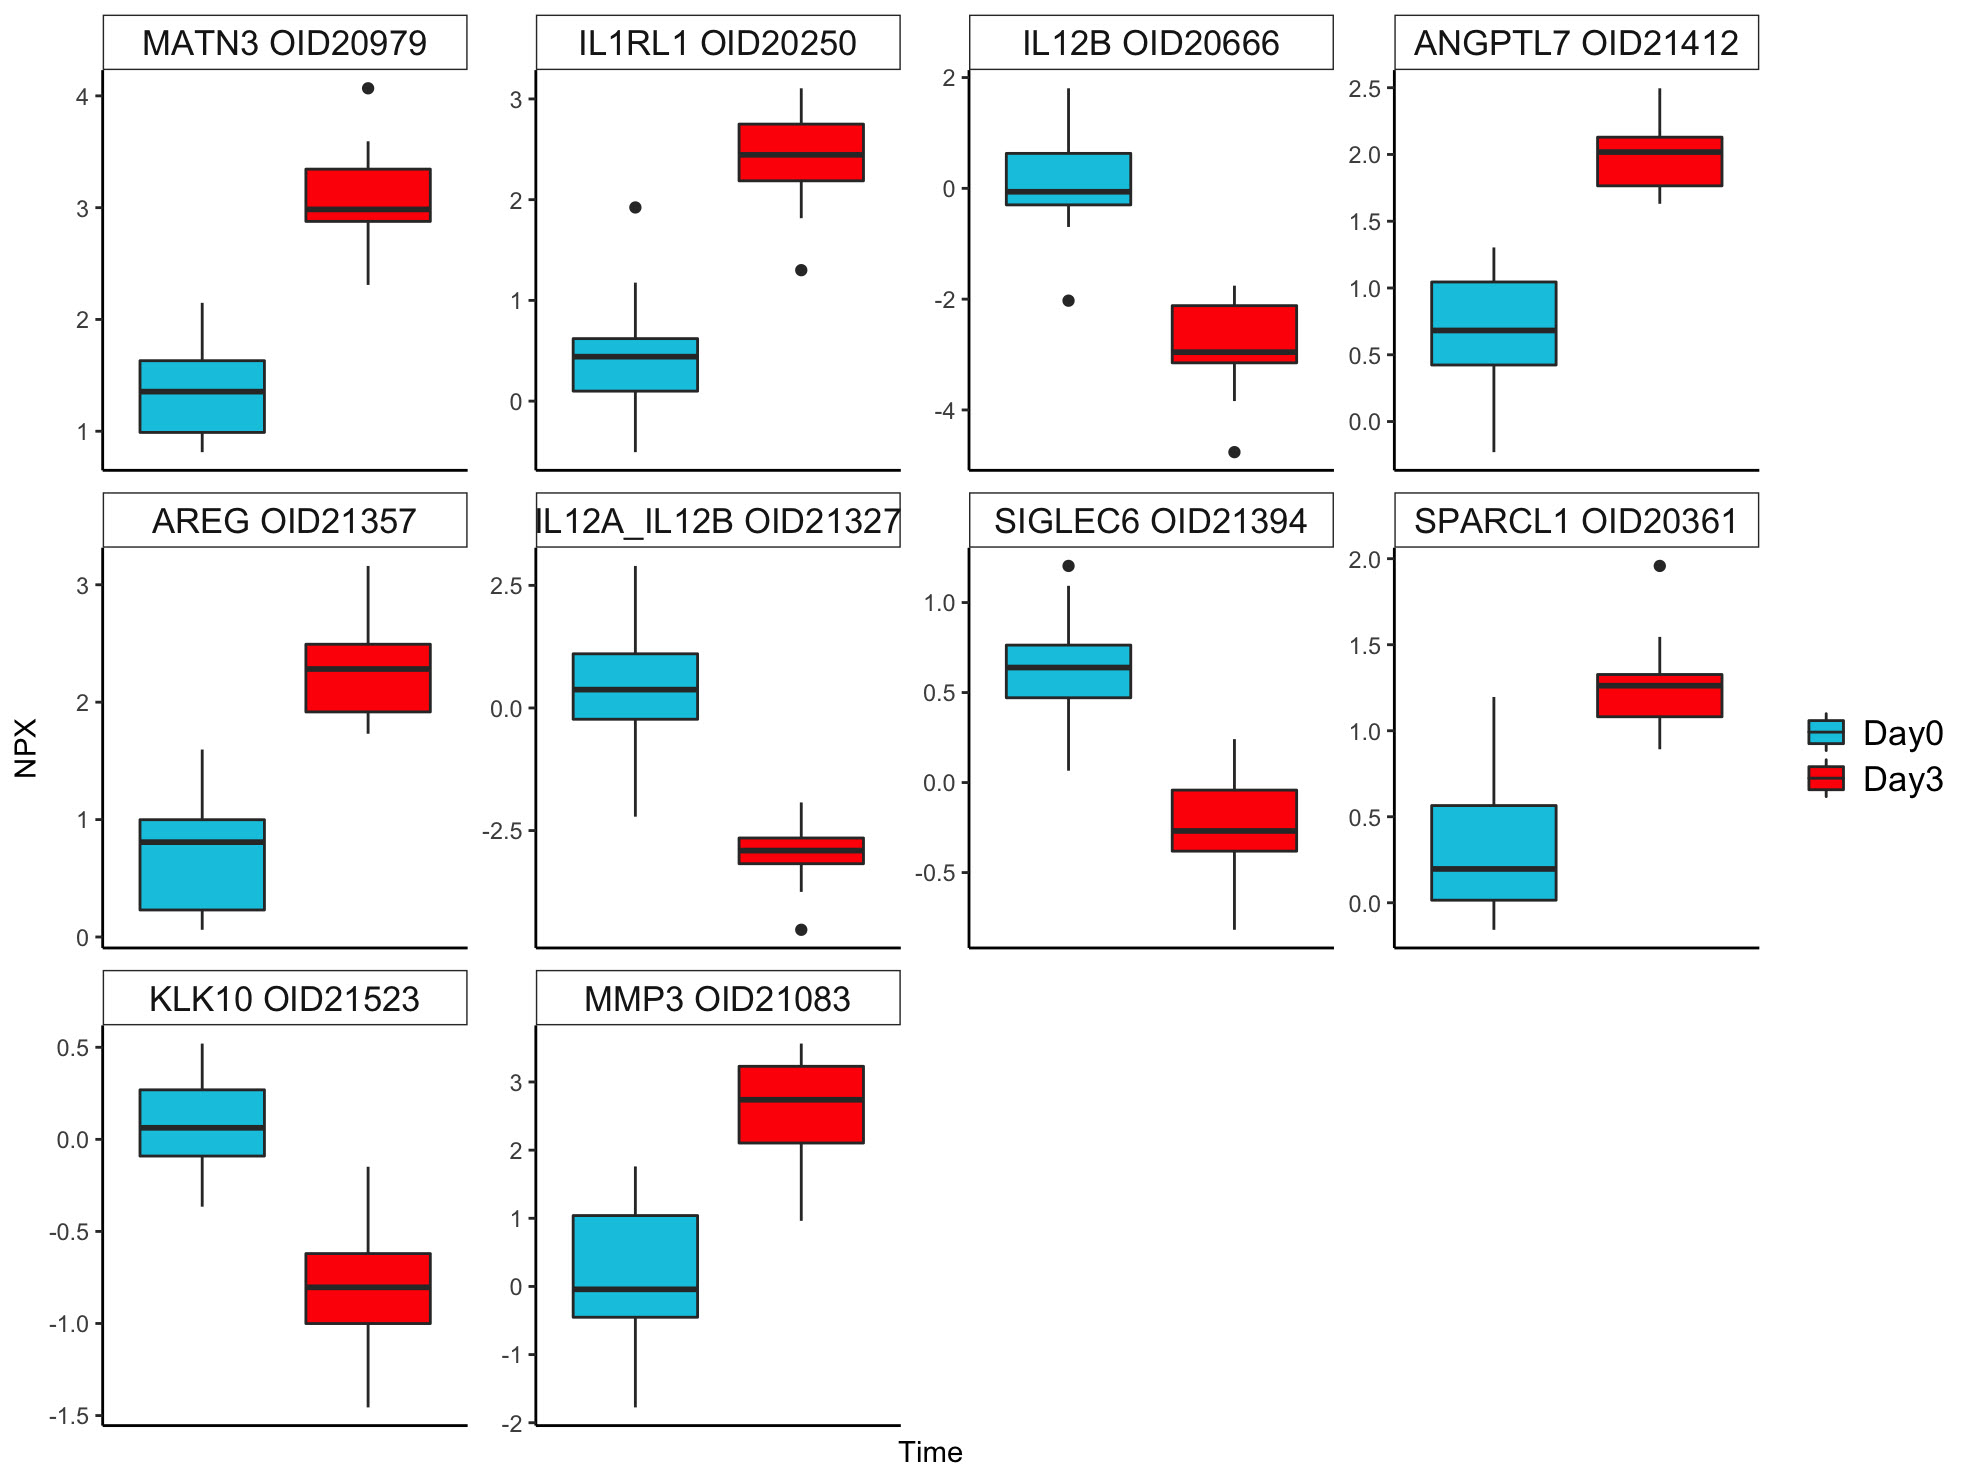 Ten most significant differentially expressed proteins between day 0 vs day 3.
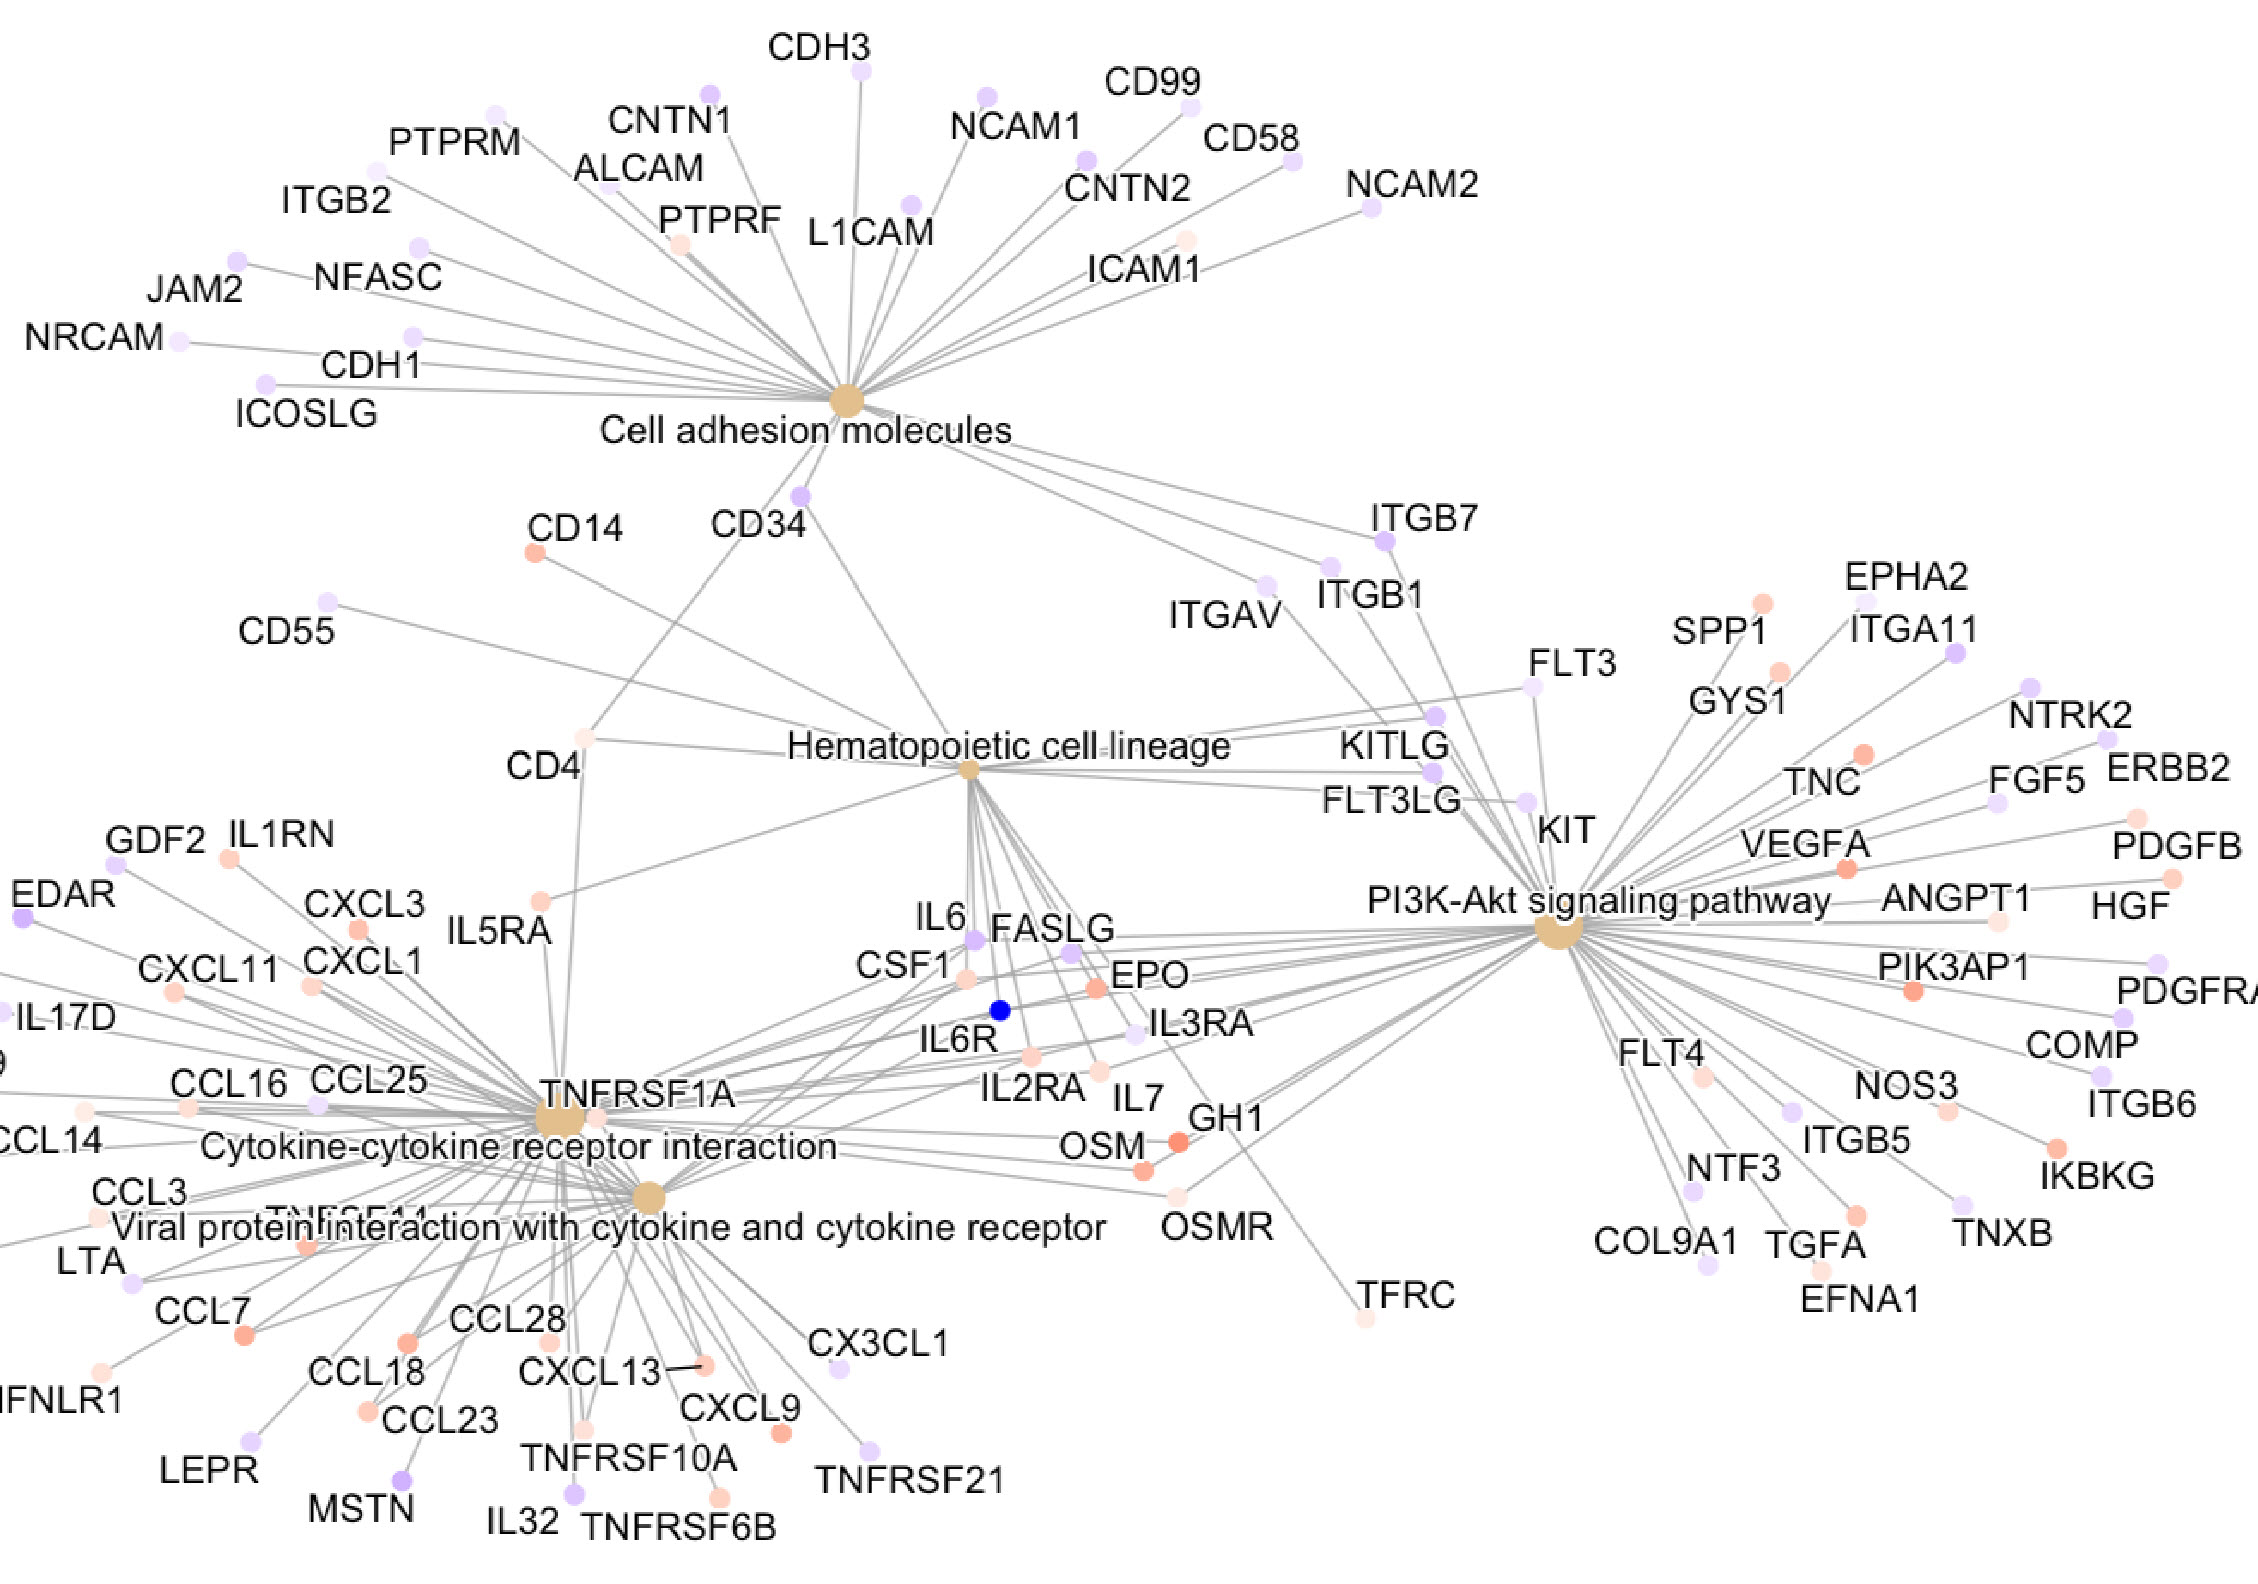 Network plot of the top 5 KEGG pathways from day 0 vs week 52. Size in the figure legend refers to the number of proteins in each pathway. Estimate in the figure legend indicates the log2 fold change from day 0 vs week 52.