
Abstract Session
Fibrosing rheumatic diseases (scleroderma, MCTD, IgG4-related disease, scleroderma mimics)
Kimberly S. Lakin, MD, MS
Hospital for Special Surgery
New York, NY, United States
.jpg)
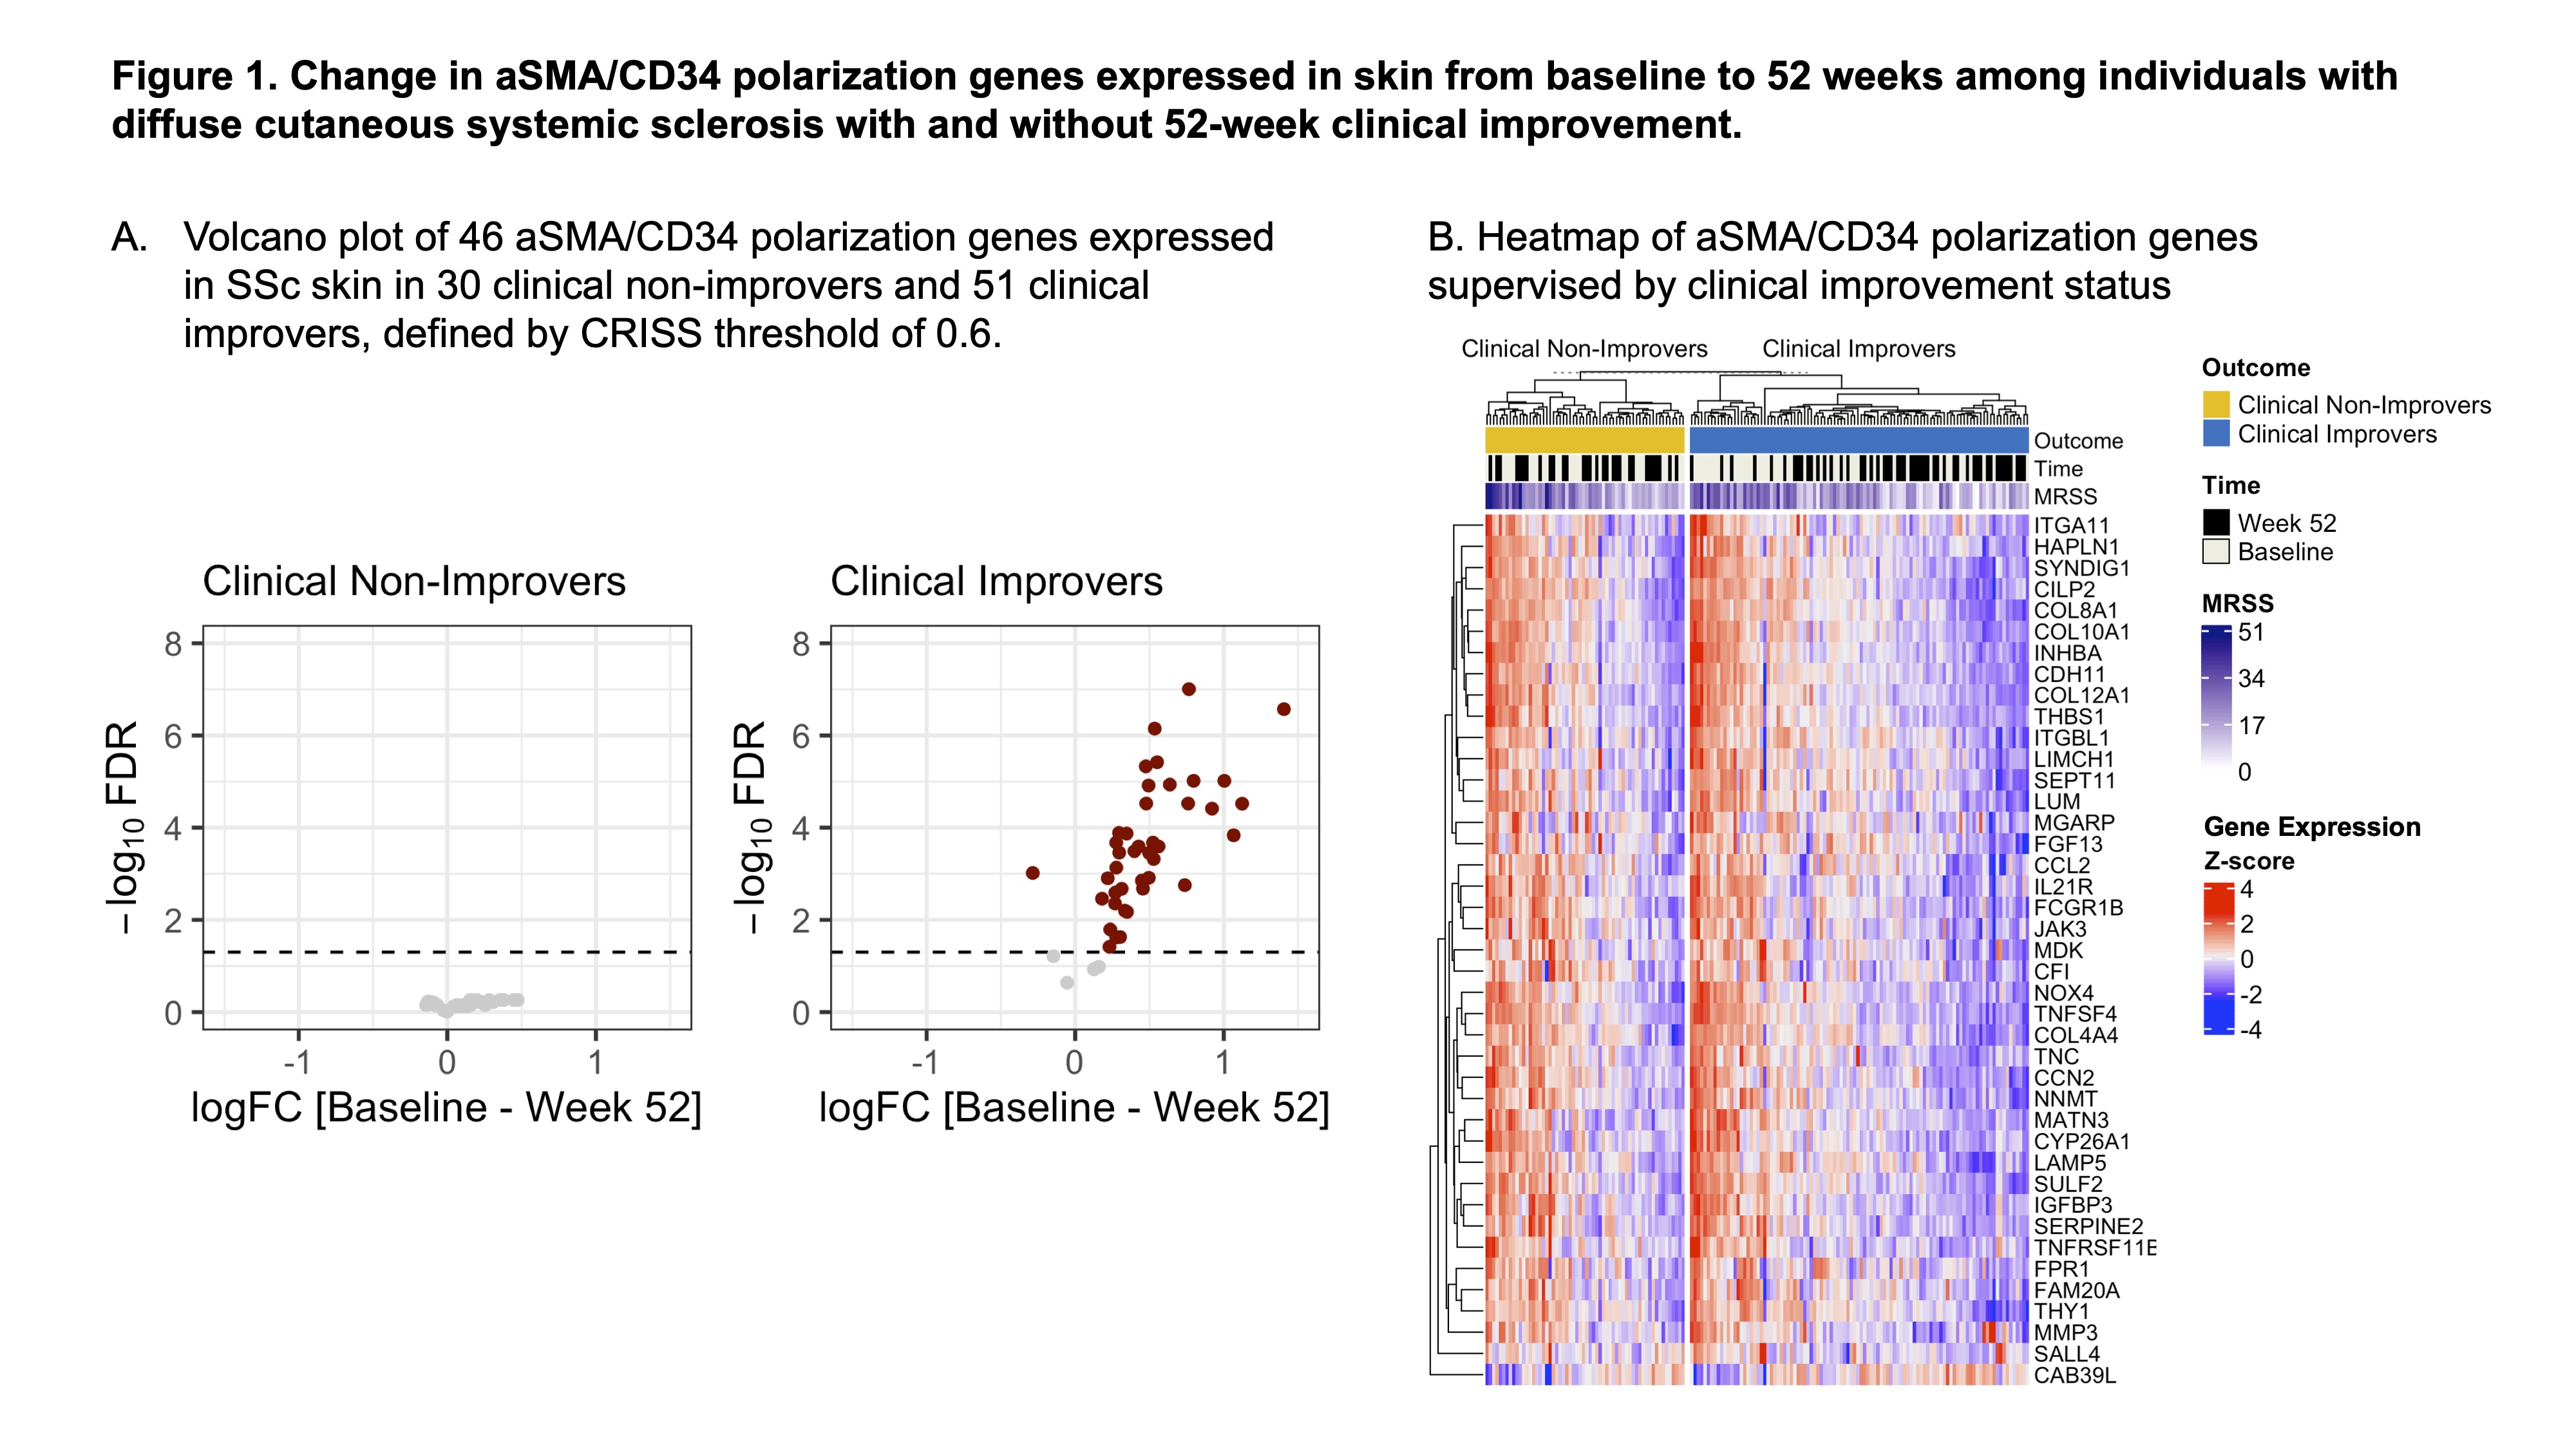 Figure 1. Change in aSMA/CD34 polarization genes expressed in skin from baseline to 52 weeks among individuals with diffuse cutaneous systemic sclerosis with and without 52-week clinical improvement. (A) Volcano plot of 46 aSMA/CD34 polarization genes expressed in SSc skin in 30 clinical non-improvers and 51 clinical improvers, defined by CRISS threshold of 0.6. (B) Heatmap of aSMA/CD34 polarization genes supervised by clinical improvement status.
.jpg) Figure 2. Change in aSMA/CD34 polarization gene expression in skin compared to clinical improvement. (A) Average expression of aSMA/CD34 polarization genes at baseline and 52 weeks by clinical improvement status. Red line indicates equal average gene expression between clinical improvers and non-improvers. (B) Heatmap demonstrates Pearson correlation coefficients for Log2(fold-change baseline versus 52 weeks) of 46 aSMA/CD34 polarization genes with (A) CRISS and (B) total MRSS change, measured as baseline minus 52 weeks (i.e., positive MRSS change indicates points of “improvement” in total skin score at 52 weeks).
Figure 2. Change in aSMA/CD34 polarization gene expression in skin compared to clinical improvement. (A) Average expression of aSMA/CD34 polarization genes at baseline and 52 weeks by clinical improvement status. Red line indicates equal average gene expression between clinical improvers and non-improvers. (B) Heatmap demonstrates Pearson correlation coefficients for Log2(fold-change baseline versus 52 weeks) of 46 aSMA/CD34 polarization genes with (A) CRISS and (B) total MRSS change, measured as baseline minus 52 weeks (i.e., positive MRSS change indicates points of “improvement” in total skin score at 52 weeks).