
Poster Session D
Osteoarthritis (OA) and related disorders
Rhea Mehta, BA, MHS
University of Maryland, Baltimore
Baltimore, MD, United States
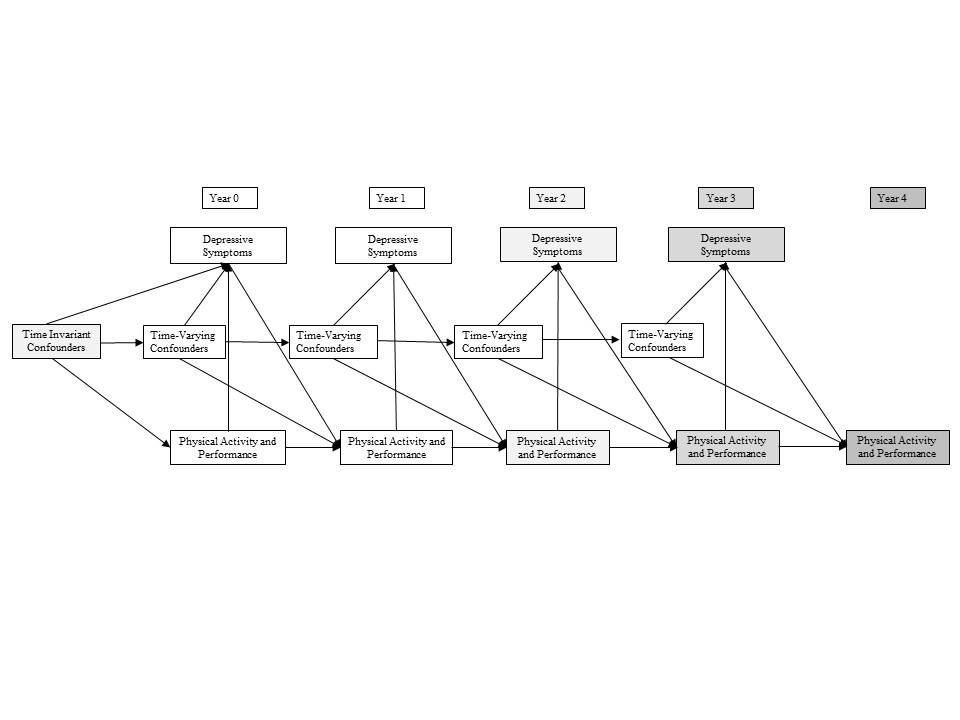 Figure 1. Directed Acyclic Graph Depicting the Epidemiological Study Design and Hypothesized Causal Relationships Between Depressive Symptoms, Functional Outcomes, Time-Invariant and Time-Varying Confounders
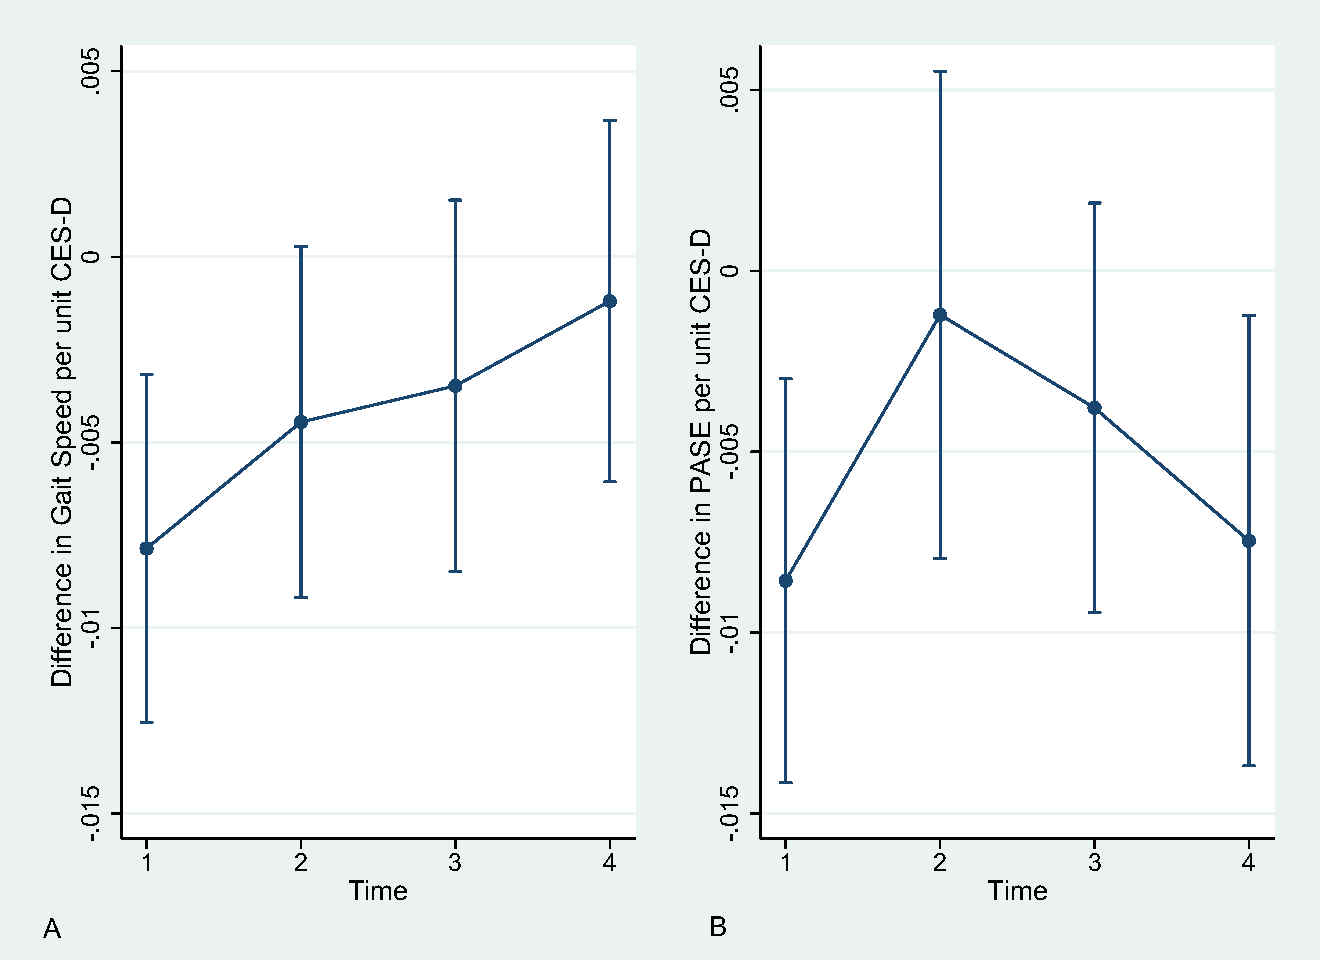 Figure 2. Average Marginal Effects of Time-Varying CES-D Scores on Standardized A) Gait Speed and B) PASE. CESD: Center for Epidemiological Studies Scale; PASE: Physical Activity Scale for the Elderly