
Abstract Session
Systemic lupus erythematosus (SLE)

Andrea Fava, MD
Johns Hopkins University
Baltimore, MD, United States
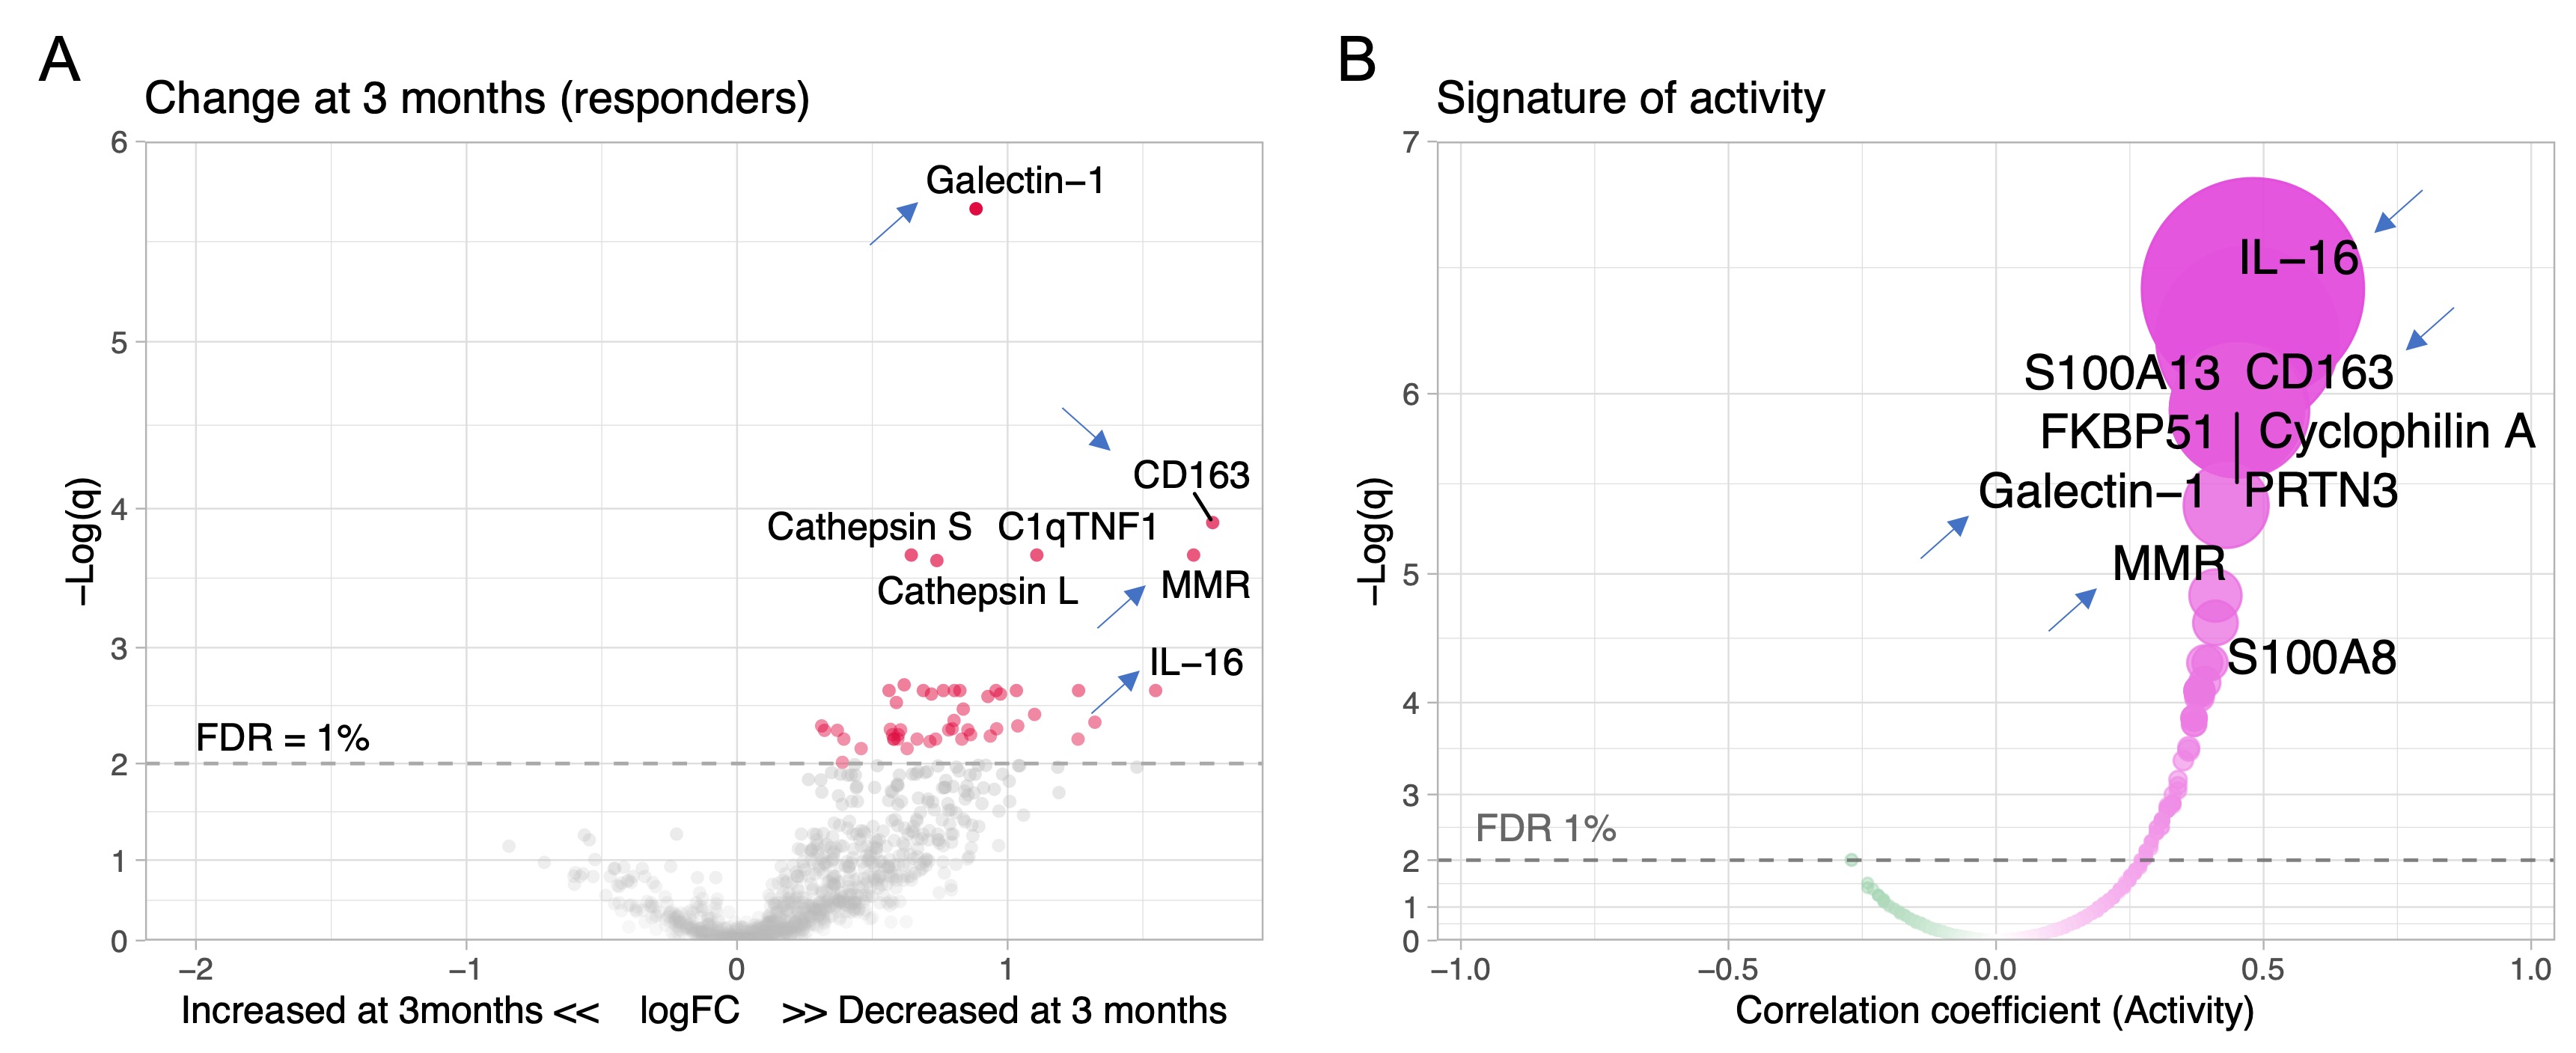 Figure 1. Proteins linked to intrarenal activity (NIH activity index) decrease in treatment responders. Volcano plot of the changes of the urinary proteomic profile of treatment responders at 3 months (A) after kidney biopsy/treatment compared to baseline at time of biopsy. (B) Volcano plot displaying the Spearman’s correlation coefficients of urinary biomarkers at time of biopsy with histological activity defined as the NIH activity index. Blue arrows indicate 4 examples of shared urinary biomarkers that indicate both intrarenal activity and response to treatment. FDR, false discovery rate; q, adjusted p value.
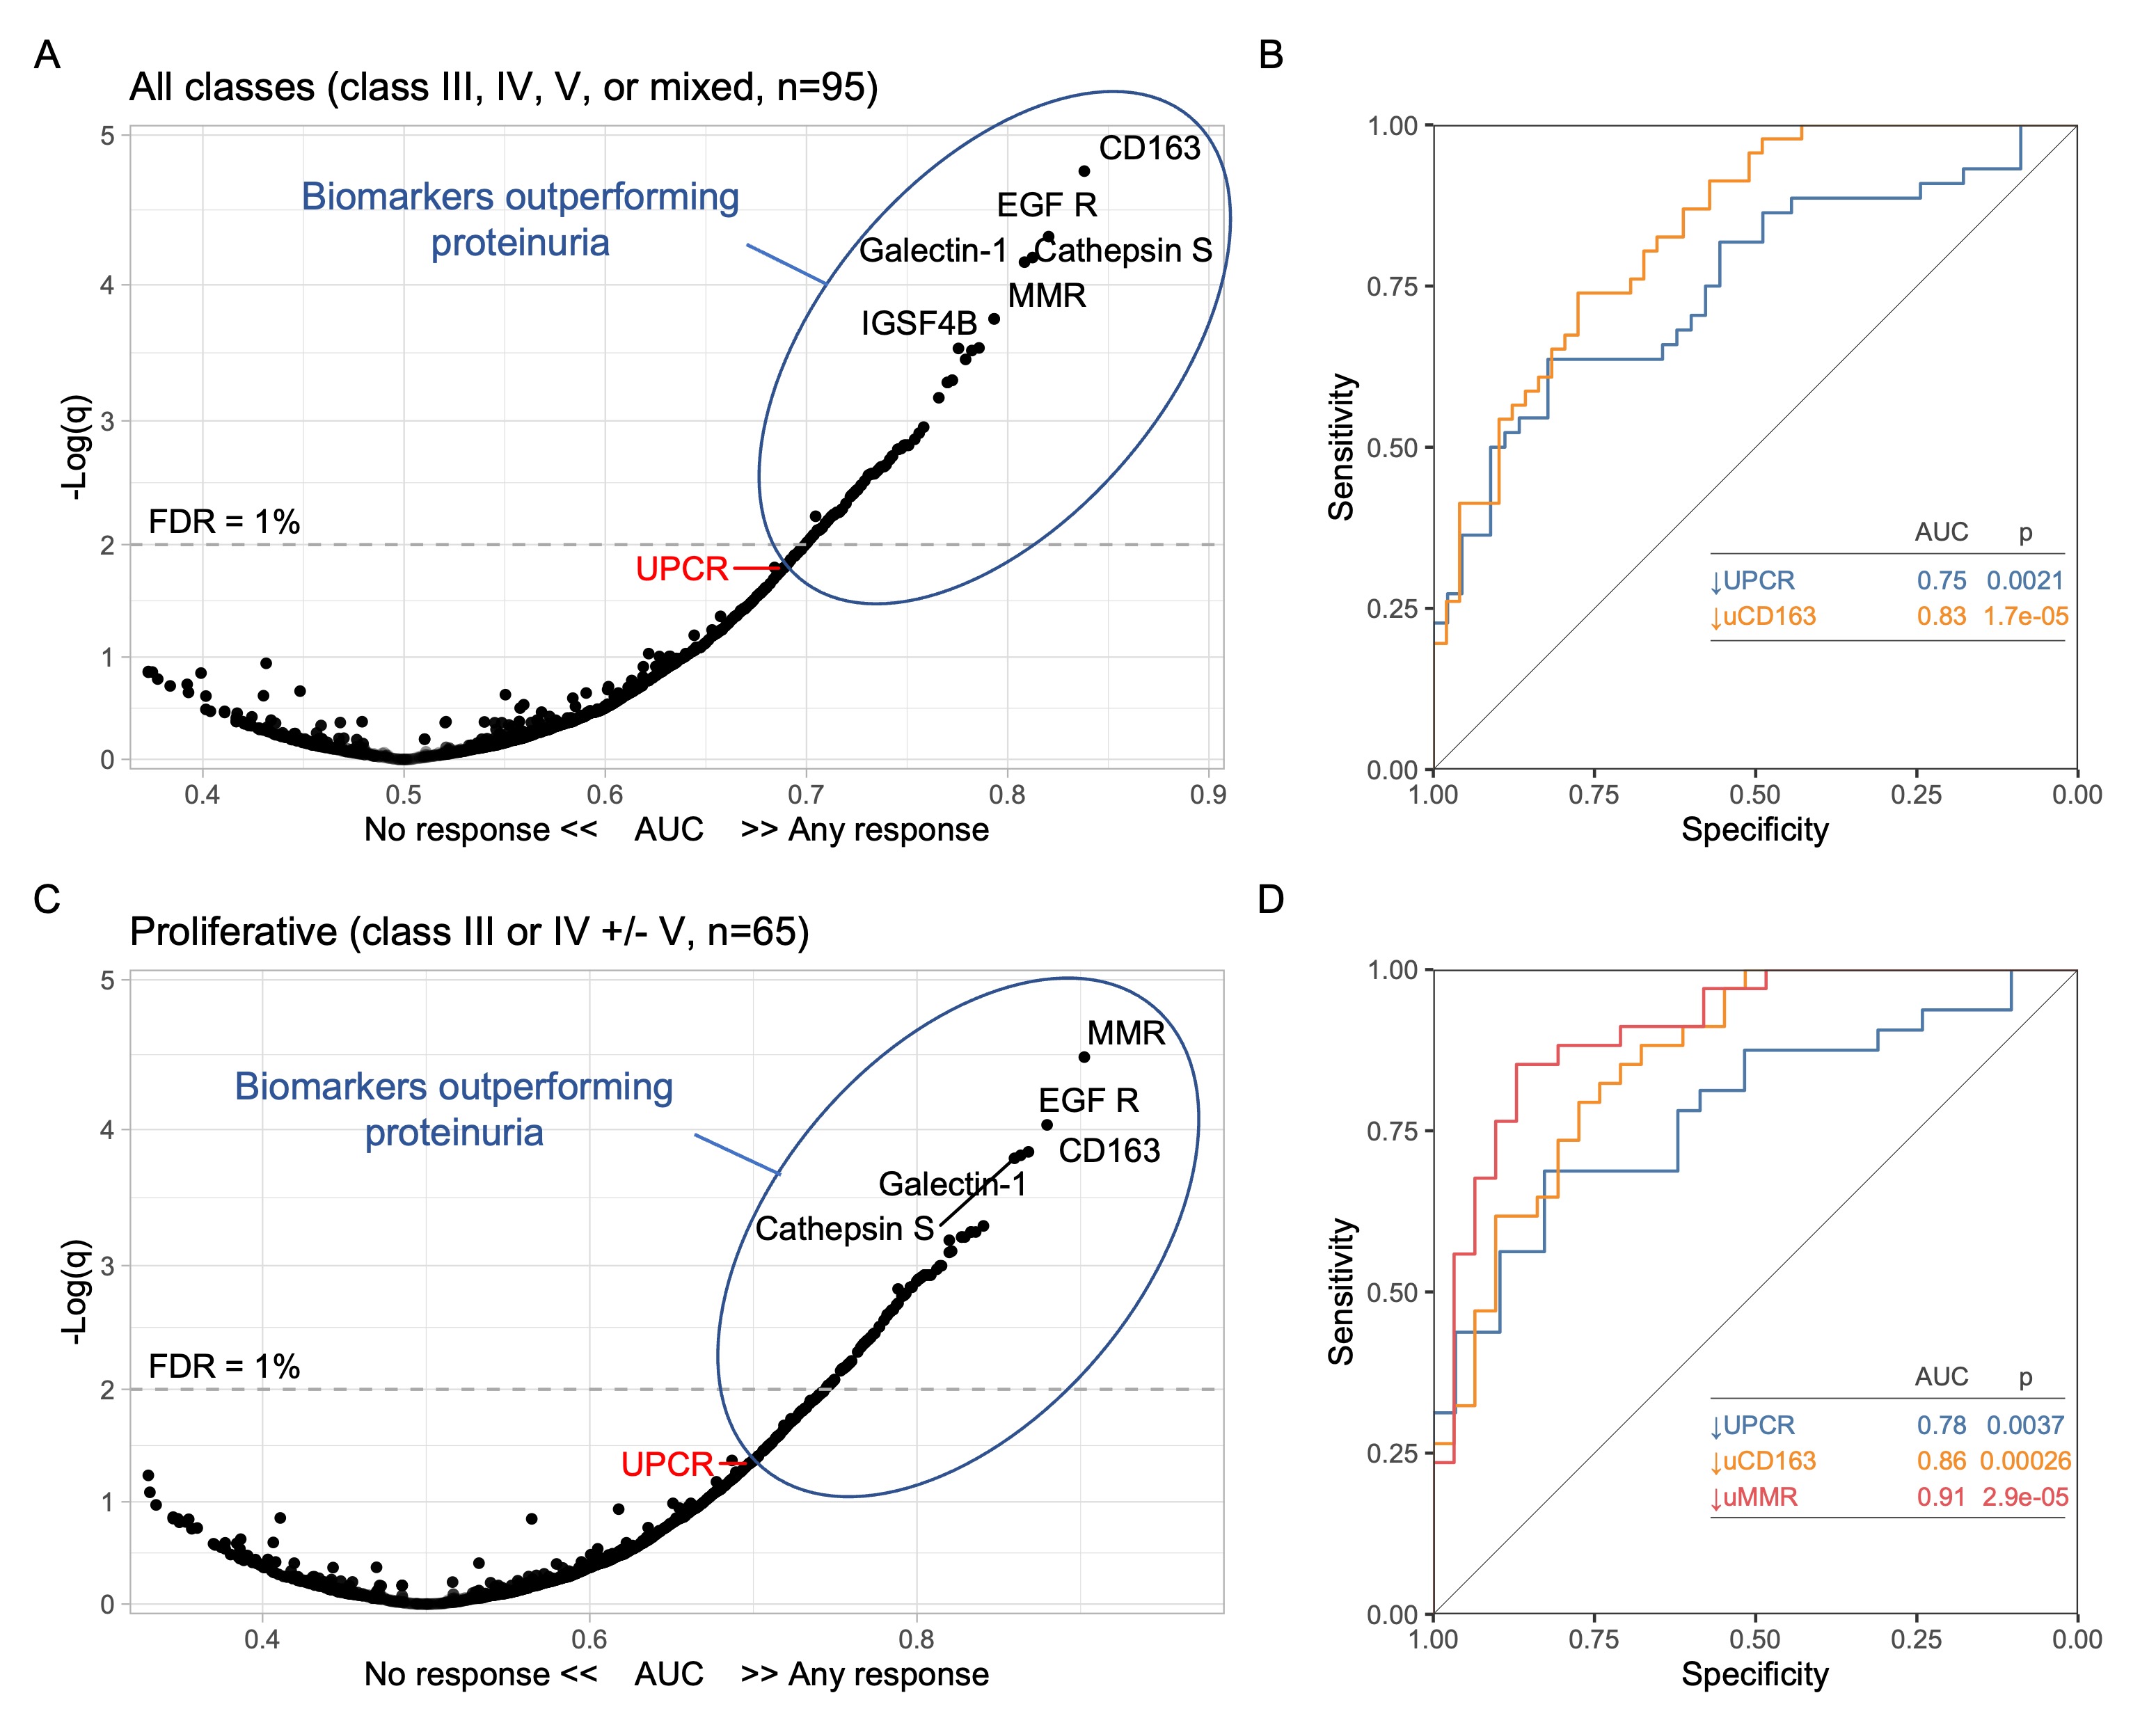 Figure 2. Changes in specific urinary biomarkers at 3 months predict 1-year response better than proteinuria (urine protein-to-creatinine ratio, UPCR). Analyses for all patients and for proliferative LN only are summarized and A-B and C-D, respectively. (A, C) Volcano plots displaying the area under the curve (AUC) indicating the performance of a change of a biomarker at 3 months compared to the urine sample collected at time of kidney biopsy. For reference, UPCR (the current clinically used biomarker) is indicated in red. (B, D) ROC curves comparing the performance of a decline at 3 months of UPCR and urinary biomarkers. FDR, false discovery rate. q, adjusted p value.