
Poster Session D
Osteoarthritis (OA) and related disorders
Yun-Chen Tsai, MD
Chang Gung memorial hospital
Taoyuan, Taiwan
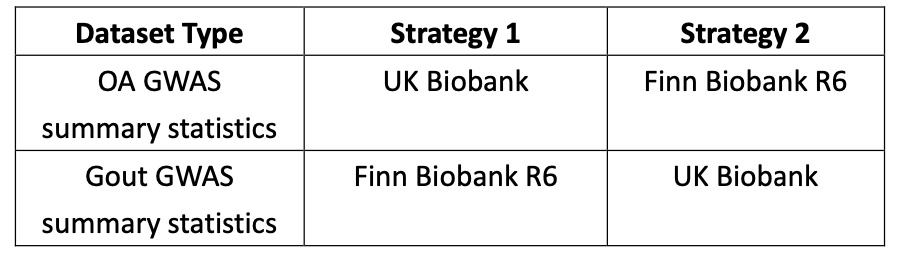 Table 1: Two strategies for using different datasets in the present MR study
 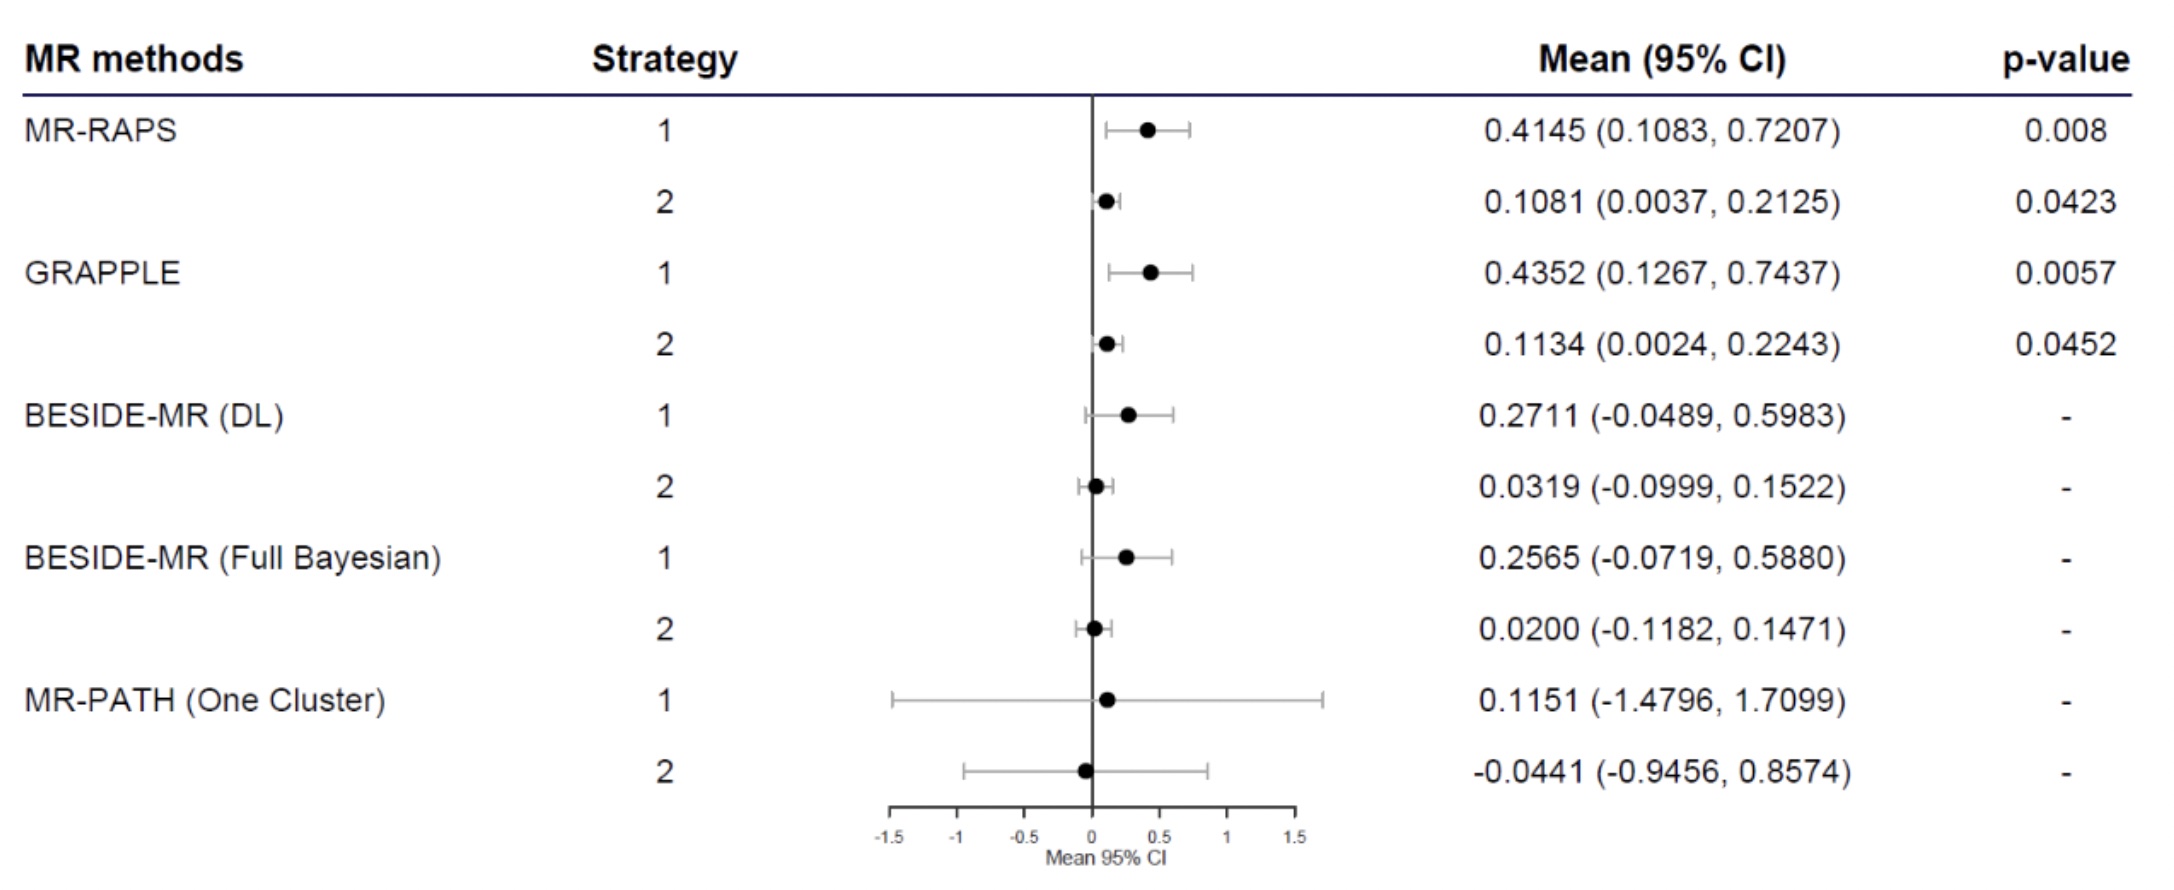 Figure 1: The causal effect of the osteoarthritis on gout in univariate MR analysis. The mean effects, 95% confidence or credible intervals, and p-values were contained. CI: confidence interval for MR-GENIUS, MR-RAPS, and GRAPPLE; credible interval for BESIDE-MR and MR-PATH. Mean: the mean causal effect; p-value: p-value of the mean causal effect.
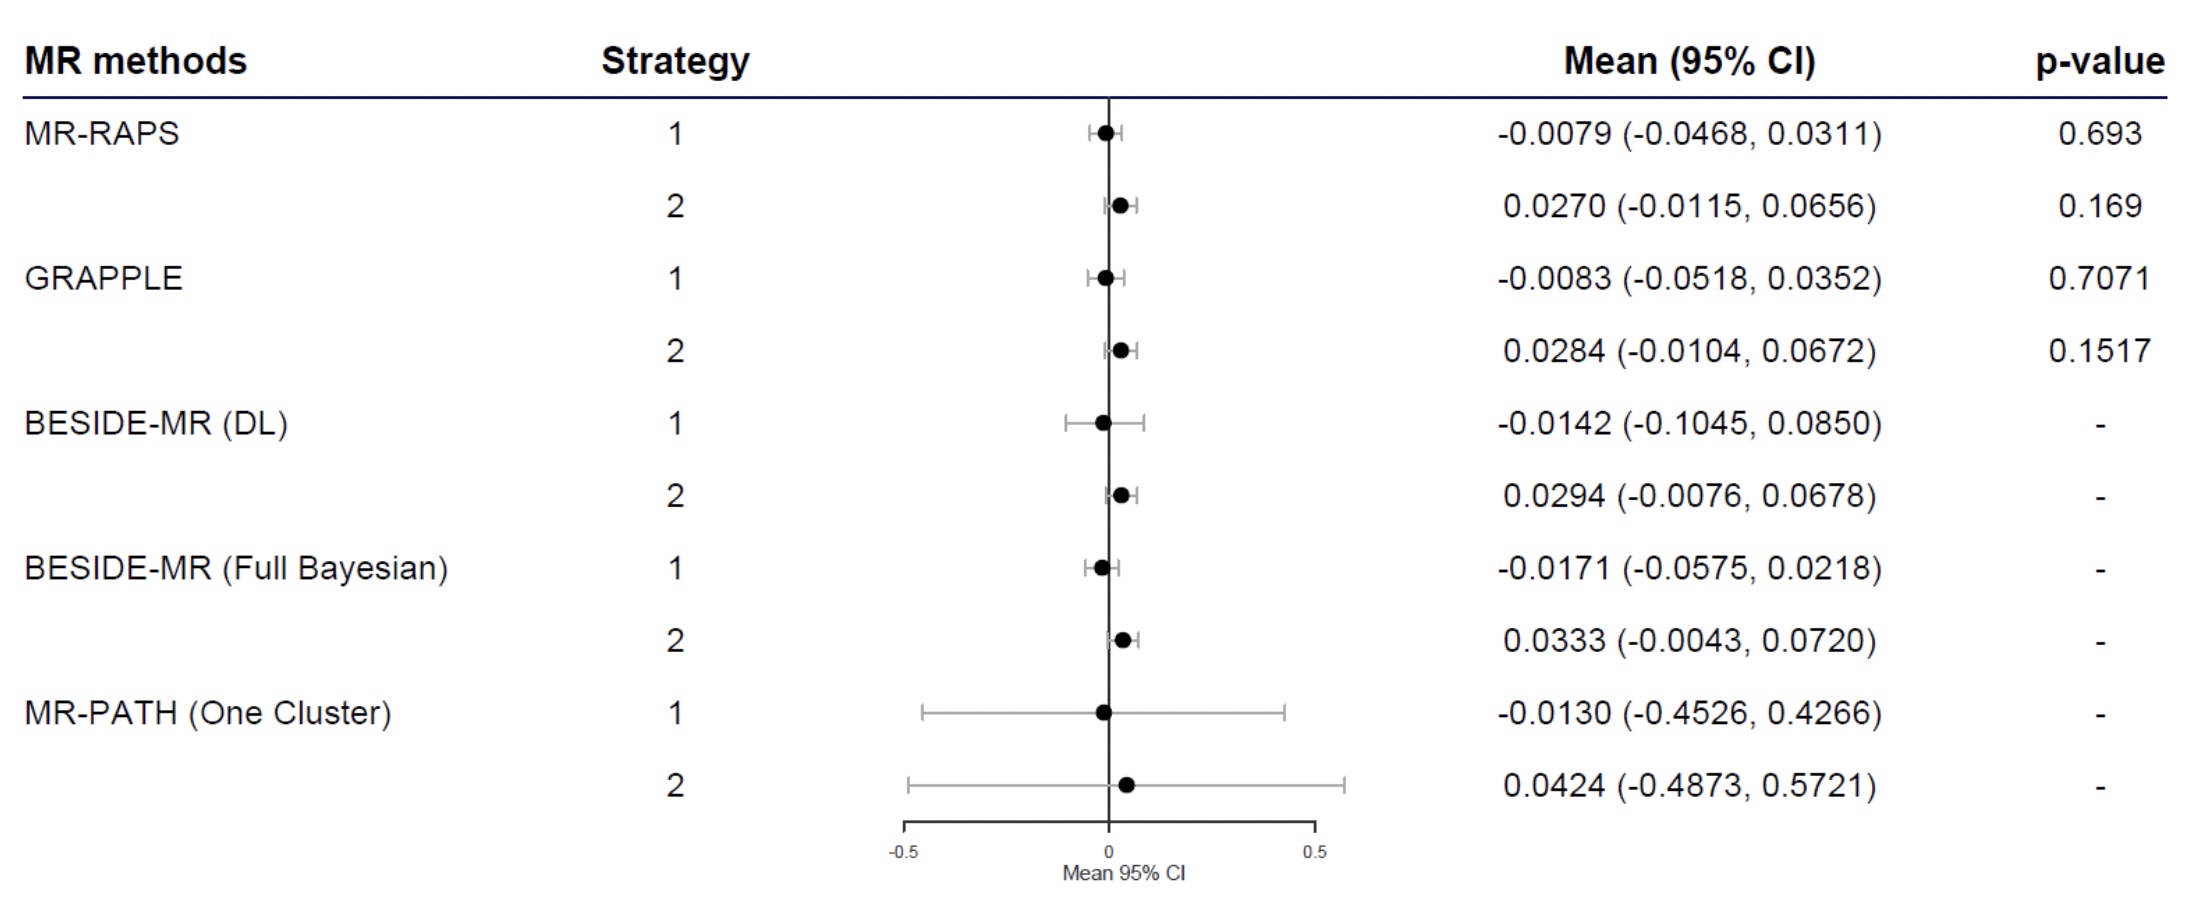 Figure 2: The causal effect of gout on osteoarthritis in univariate MR analysis. The mean effects, 95% confidence or credible intervals, and p-values were contained. CI: confidence interval for MR-GENIUS, MR-RAPS, and GRAPPLE; credible interval for BESIDE-MR and MR-PATH. Mean: the mean causal effect; p-value: p-value of the mean causal effect.