
Abstract Session
Periodic fever syndromes, autoinflammatory diseases, Still’s disease and MAS/HLH
Ki Pui Lam, PhD
Division of Immunology, Boston Childrens Hospital, Harvard Medical School
Boston, MA, United States
.jpg)
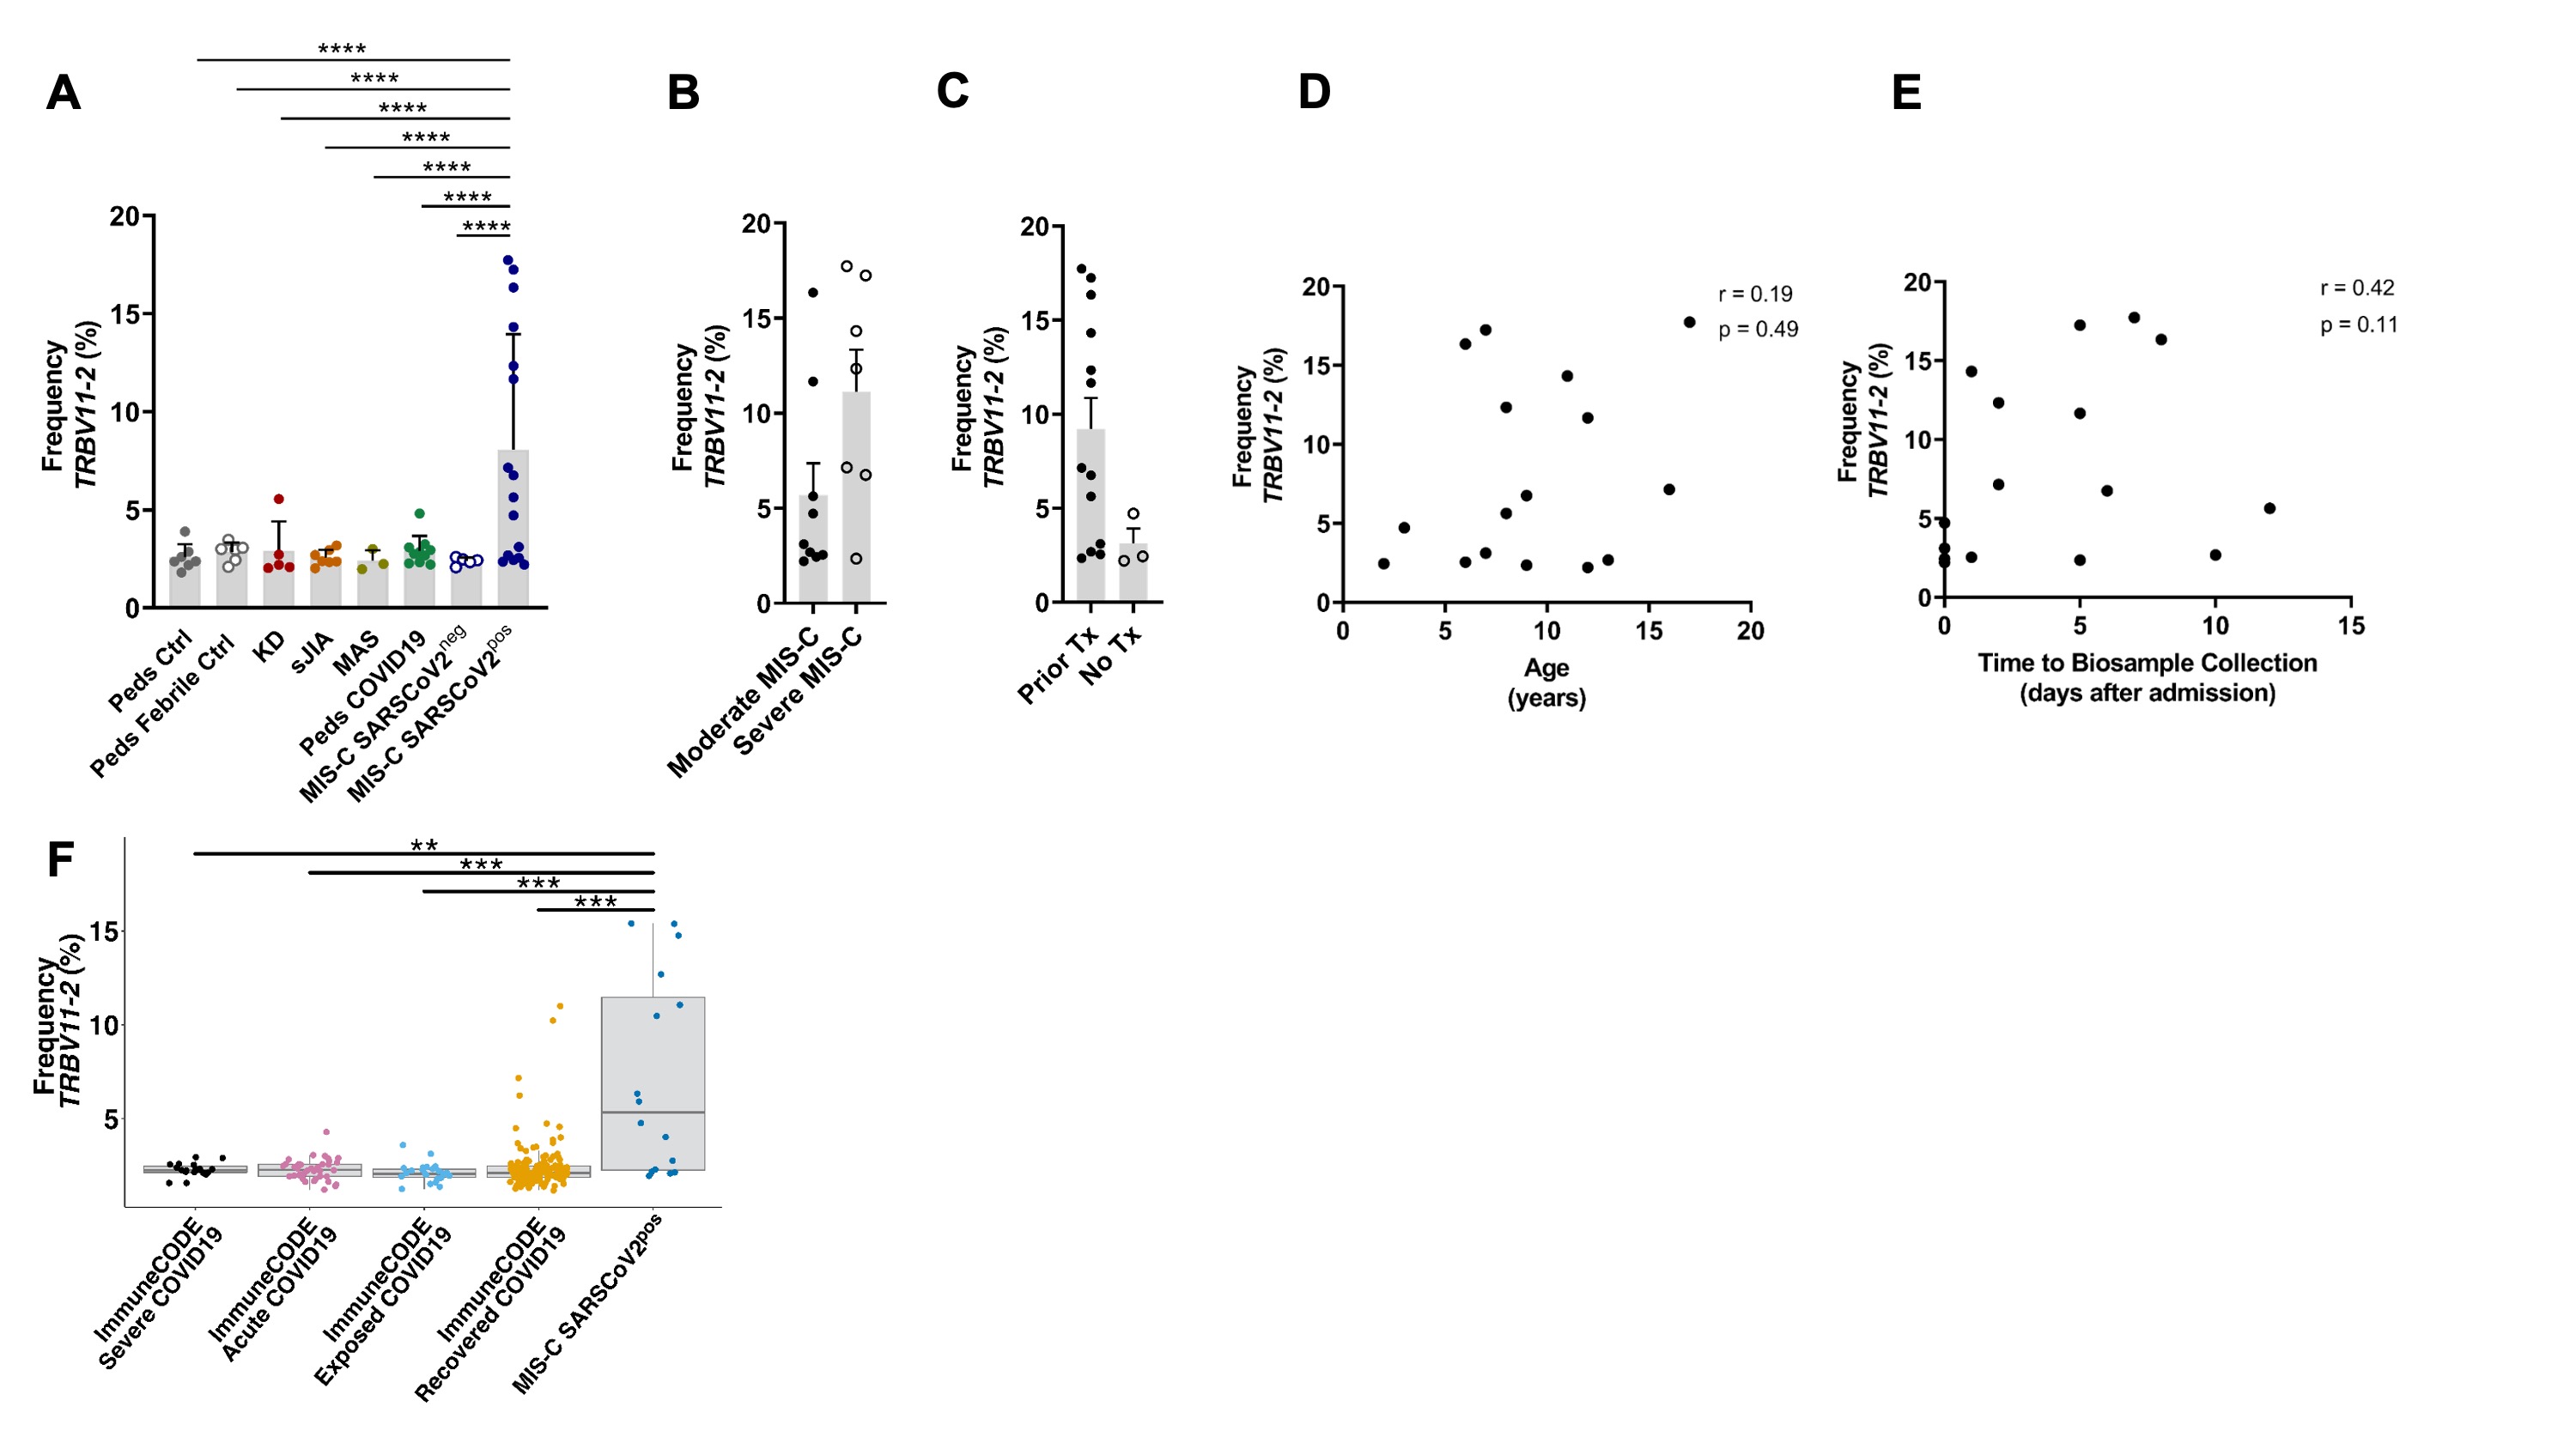 Figure 1. Increased Usage of TRBV11-2 in T cells from patients with MIS-C. A) The frequency of T cell clonotypes expressing TRBV11-2 in each study group. Statistical analysis: two-way ANOVA comparing study group and Vβ gene with the Dunnett’s multiple comparisons test. The frequency of T cell clonotypes expressing TRBV11-2 in patients with B) moderate vs. severeª MIS-C SARSCoV2pos and C) patients with MIS-C SARSCoV2pos who received prior immunomodulatory treatment vs. those who were treatment naïve. The relationship between the frequency of T cell clonotypes expressing TRBV11-2 and D) the age and E) time from hospital admission to biosample collection in patients with MIS-C SARSCoV2pos. Statistical analysis: Spearman’s non-parametric rank correlation. F) The frequency of T cell clonotypes expressing TRBV11-2 in MIS-C SARSCoV2pos and adults in the ImmuneCODE database. Statistical analysis: Wilcoxon test. Summary data on bar graphs is mean ± standard error in A-E and median with IQR in F. P value, **** ≤ 0.0001, ***=0.001, **=0.01, *=0.05.
 .jpg) Figure 2. SARS-CoV-2 Specific T Cell Responses in MIS-C. SARS-CoV-2 specific TCR sequences were obtained from the ImmuneCODE database. Antigen-specific T cells were identified by the expression of activation markers following exposure to SARS-CoV-2 peptides. These T cells were then isolated for TCR sequencing. A) The median frequency with IQR of the top 10 most abundant SARS-CoV-2-specific TCRs. B-C) Viral antigens recognized by SARS-CoV-2-specific TCRs in B) MIS-C SARSCOV2pos and C) pediatric COVID-19. D-E) Peripheral blood mononuclear cells were incubated with either water (negative control) or peptide pools covering the S1, N, and M viral proteins. SARS-CoV-2 -specific T cells were identified by their expression of CD154 (CD40 ligand). D) Flow cytometry dot plots depicting CD40L expression on T cells from a healthy control, child with convalescent COVID-19ª, and child with MIS-C SARSCOV2pos. E) Frequency of CD4+CD40L+ or CD8+CD40L+ T cells in the given study group. Summary data on bar graphs is mean ± standard error. P value * ≤ 0.05, ** ≤ 0.01.
Figure 2. SARS-CoV-2 Specific T Cell Responses in MIS-C. SARS-CoV-2 specific TCR sequences were obtained from the ImmuneCODE database. Antigen-specific T cells were identified by the expression of activation markers following exposure to SARS-CoV-2 peptides. These T cells were then isolated for TCR sequencing. A) The median frequency with IQR of the top 10 most abundant SARS-CoV-2-specific TCRs. B-C) Viral antigens recognized by SARS-CoV-2-specific TCRs in B) MIS-C SARSCOV2pos and C) pediatric COVID-19. D-E) Peripheral blood mononuclear cells were incubated with either water (negative control) or peptide pools covering the S1, N, and M viral proteins. SARS-CoV-2 -specific T cells were identified by their expression of CD154 (CD40 ligand). D) Flow cytometry dot plots depicting CD40L expression on T cells from a healthy control, child with convalescent COVID-19ª, and child with MIS-C SARSCOV2pos. E) Frequency of CD4+CD40L+ or CD8+CD40L+ T cells in the given study group. Summary data on bar graphs is mean ± standard error. P value * ≤ 0.05, ** ≤ 0.01.