
Abstract Session
Epidemiology, health policy and outcomes
Anna Montgomery, BS, MPH
University of California San Francisco
Reno, NV, United States
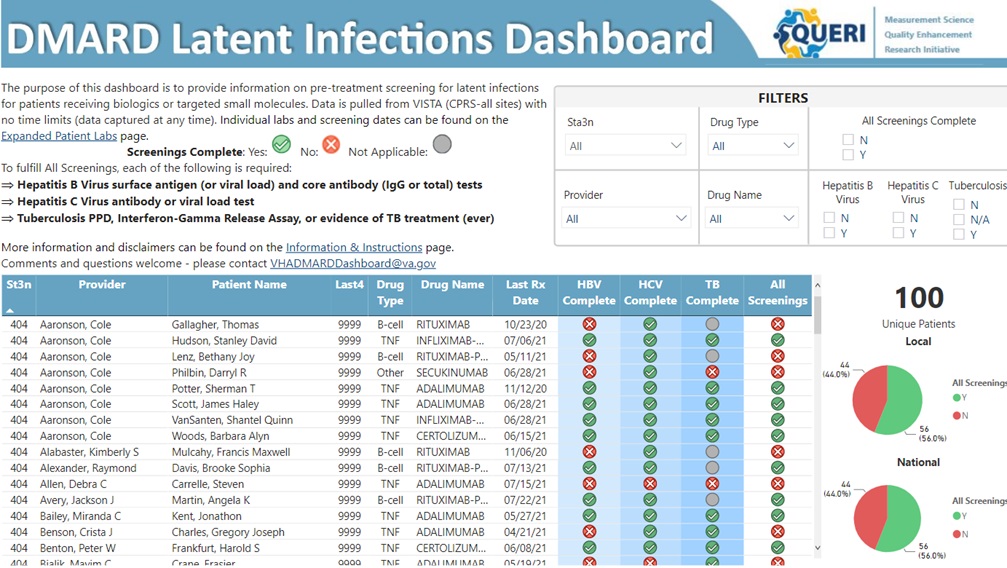 Figure 1. DMARD Patient Safety Dashboard (displays fictitious patient and provider information).
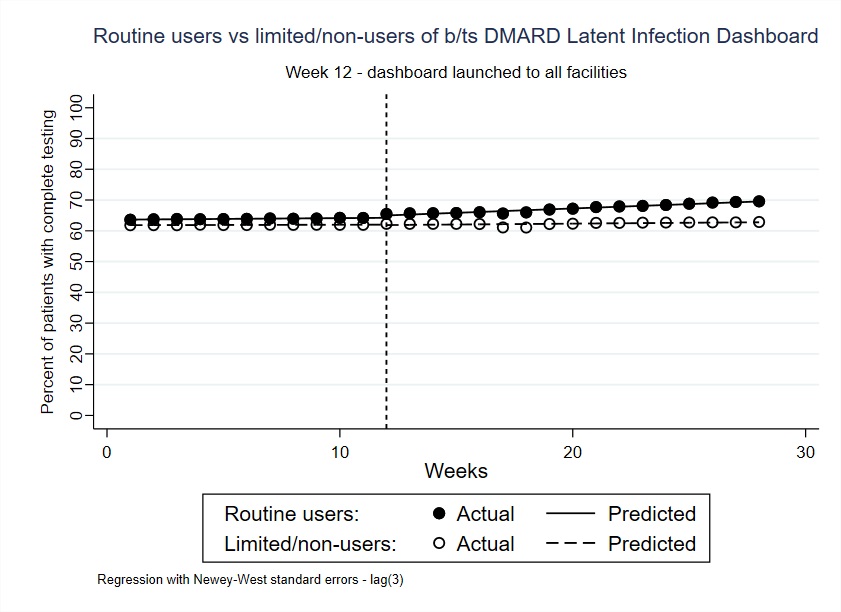 Figure 2. Actual and predicted percent of patients in the VHA using biologic or targeted-synthetic DMARDs with complete testing for latent infections (HBV, HCV, TB). Predicted percents are derived from an interrupted time series (ITS) model which adjusted for facility-level covariates, including facility complexity and the number of patients prescribed b/tsDMARDs. FootnoteL Percent of patients with complete testing is captured via the dashboard in weekly intervals. Dotted line represents the intervention date in the ITS analysis (January 11th, 2022; date on which the dashboard was available to all VHA facilities). Routine vs. limited/non-users of the dashboard were defined based on the number of logins from a specific facility (above/below the median, those with > 8 logins were designated “routine users” vs. ≤ 8 logins “limited/non-users”).