
Poster Session D
Immunobiology
.jpg "Nozima Aripova, BS photo")
Nozima Aripova, BS
University of Nebraska Medical Center
Omaha, NE, United States
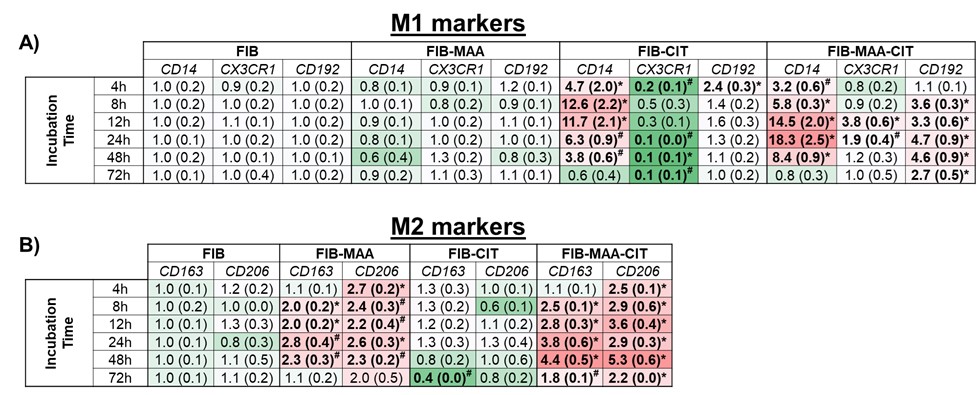 Figure 1. Timed RT-PCR for M1 and M2 markers from stimulated U-937 cells after exposing M0 cells to FIB, FIB-MAA, FIB-CIT, or FIB-MAA-CIT. FIB: fibrinogen, FIB-MAA: fibrinogen-MAA, FIB-CIT: fibrinogen-citrulline, FIB-MAA-CIT: fibrinogen-MAA-citrulline. A) M1 markers and B) M2 markers. The data is represented as a mean (standard deviation) of Relative quantity (Rq) of M1 and M2 markers. Red boxes represent increased mRNA levels, while green boxes represent decreased mRNA levels. All the values are compared to FIB. *p < 0.001, #p < 0.05, n=3.
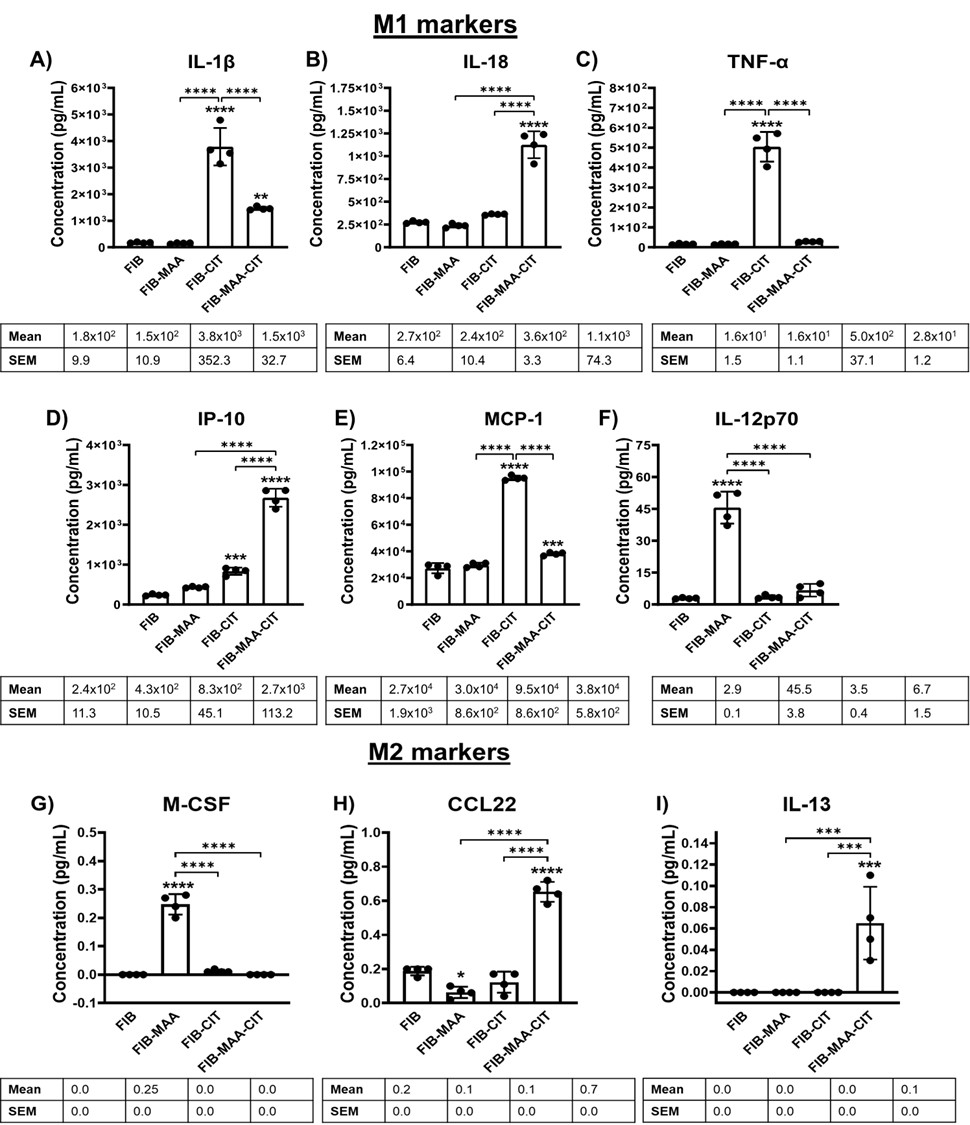 Figure 2. M1 and M2 cytokine concentrations by exposure group. from stimulated U-937 cells. FIB: fibrinogen, FIB-MAA: fibrinogen-MAA, FIB-CIT: fibrinogen-citrulline, FIB-MAA-CIT: fibrinogen-MAA-citrulline. The following M1 cytokines were measured: A) IL-1β, B) IL-18, C) TNF-α, D) IFNγ-inducible protein (IP)-10, E) monocyte chemoattractant protein (MCP)-1, F) IL-12p70. The following M2 cytokines were measured: G) macrophage colony-stimulating factor (M-CSF), H) macrophage derived chemokine (CCL22), I) IL-13. The data is represented as a mean of cytokine concentrations (pg/mL) and reported with SEM. Comparisons made to FIB are illustrated above each bar: ****p < 0.0001, ***p < 0.001, **p < 0.01, *p < 0.05, n=4. Tukey’s post-hoc test comparisons are illustrated between treatment groups, and only significant differences are illustrated: ****p < 0.0001, ***p < 0.001, **p < 0.01, *p < 0.05.
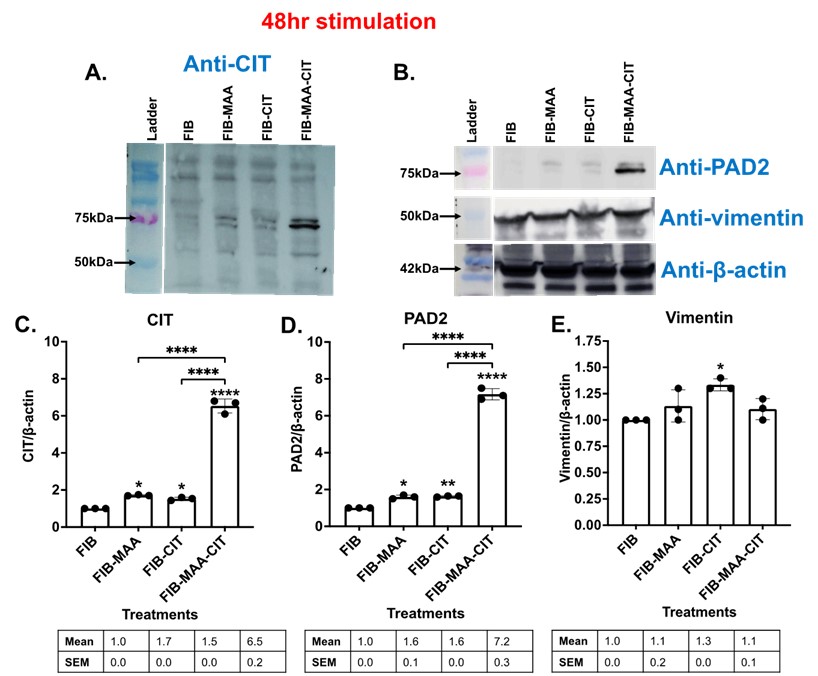 Figure 3. Western Blot for PAD enzyme expression and citrullination from stimulated M0 cells. M0 cells were stimulated with modified fibrinogen antigens for 48 hours. CIT: citrullination, FIB: fibrinogen, FIB-MAA: fibrinogen-MAA, FIB-CIT: fibrinogen-citrulline, FIB-MAA-CIT: fibrinogen-MAA-citrulline, PAD: peptidyl-arginine deiminase. Cell lysates were probed with (A) anti-citrulline, (B) anti-PAD2, anti-vimentin, and anti-β-actin antibodies. Densitometry of normalized values to β-actin of (C) 75 kDa citrullination band for CIT, (D) PAD2, and (E) vimentin. The data is represented as a mean densitometry normalized values and reported with SEM. Comparisons made to FIB are illustrated above each bar: ****p < 0.0001, ***p < 0.001, **p < 0.01, *p < 0.05, n=3. Tukey’s post-hoc test comparisons are illustrated between treatment groups, and only significant differences are illustrated: ****p < 0.0001, ***p < 0.001, **p < 0.01, *p < 0.05.