
Poster Session B
Rheumatoid arthritis (RA)
.jpg "Nozima Aripova, BS photo")
Nozima Aripova, BS
University of Nebraska Medical Center
Omaha, NE, United States
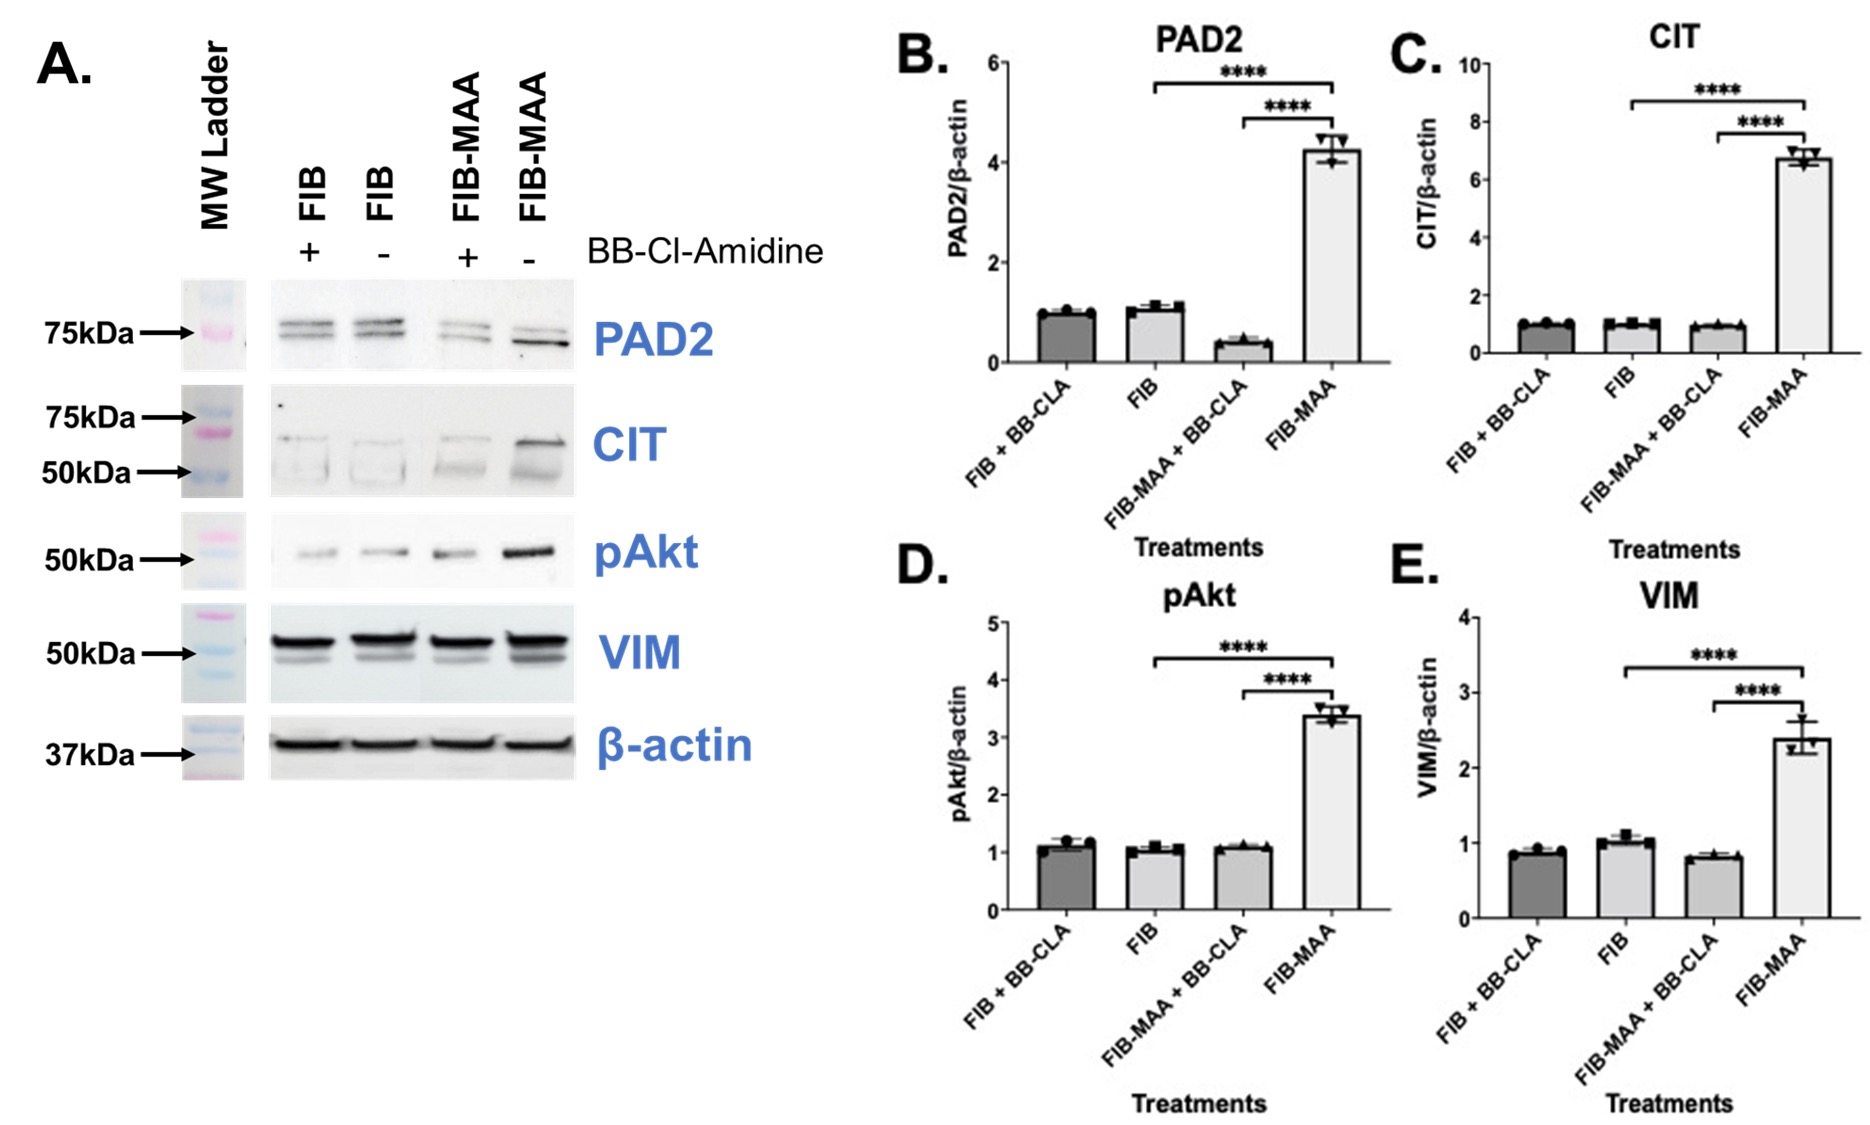 Figure 1. Western Blot from stimulated M0 cells. M0 cells were stimulated with modified fibrinogen for 48 hours. BB-CLA: BB-Cl-amidine, CIT: citrullination, FIB: fibrinogen, FIB-MAA: fibrinogen-MAA, PAD: peptidyl-arginine deiminase, pAKT: phosphorylated serine/threonine protein kinase (Akt), VIM: vimentin. (A) Cell lysates were probed with anti-PAD2, anti-CIT, anti-pAkt, anti-VIM, and anti-β-actin antibodies. Densitometry of normalized values to β-actin of (B) PAD2, (C) 75 kDa citrullination band for CIT, (D) pAkt, and (E) VIM. The data is represented as a mean densitometry normalized value. Tukey’s post-hoc test comparisons are illustrated between treatment groups, and only significant differences are illustrated: ****p < 0.001.
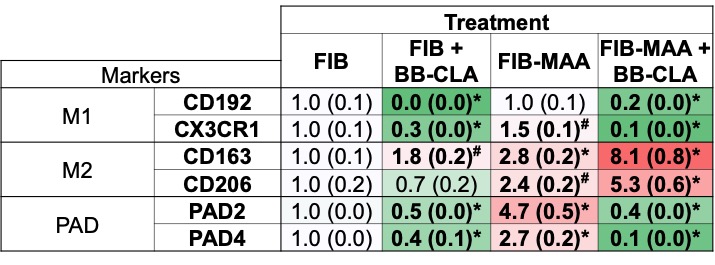 Figure 2. RT-PCR for M1 and M2 markers and PAD from stimulated U-937 cells. BB-CLA: BB-Cl-Amidine, FIB: fibrinogen, FIB-MAA: fibrinogen-MAA, PAD: peptidyl arginine deiminase. M1 markers: CD192, CX3CR1; M2 markers: CD163, CD206; PAD markers: PAD2 and PAD4. The data is represented as a mean (standard deviation) of Relative quantity (Rq) markers. Red boxes represent increased mRNA levels, while green boxes represent decreased mRNA levels. All the values are compared to FIB. *p < 0.001, #p < 0.05, n=3.