
Poster Session B
Rheumatoid arthritis (RA)

Renske Hebing, MSc
Reade
Amsterdam, Netherlands
.jpg) Figure 1. Total MTX-PG concentrations in PBMCs (left) and RBCs (right) of RA patients during the first 6 months of oral (orange) or subcutaneous (green) MTX administration. At 6 months, 18 patients using oral and 18 patients using subcutaneous MTX were still continuing MTX treatment. Note the different scaling of the Y-axis.
Figure 1. Total MTX-PG concentrations in PBMCs (left) and RBCs (right) of RA patients during the first 6 months of oral (orange) or subcutaneous (green) MTX administration. At 6 months, 18 patients using oral and 18 patients using subcutaneous MTX were still continuing MTX treatment. Note the different scaling of the Y-axis. 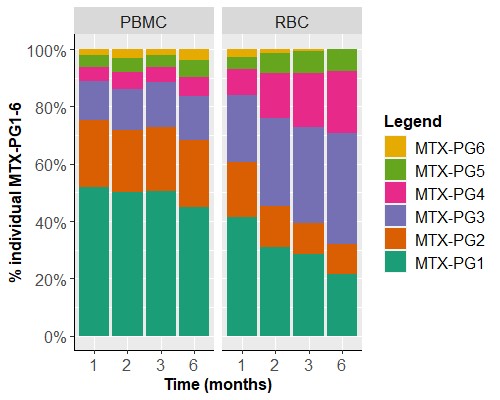 Figure 2. MTX-PG subspecies distributions in PBMCs (left) and RBCs (right) during the first 6 months of combined oral and subcutaneous MTX treatment with MTX-PG1 being most abundant in PBMCs and accumulating MTX-PG3 in RBCs over time.
 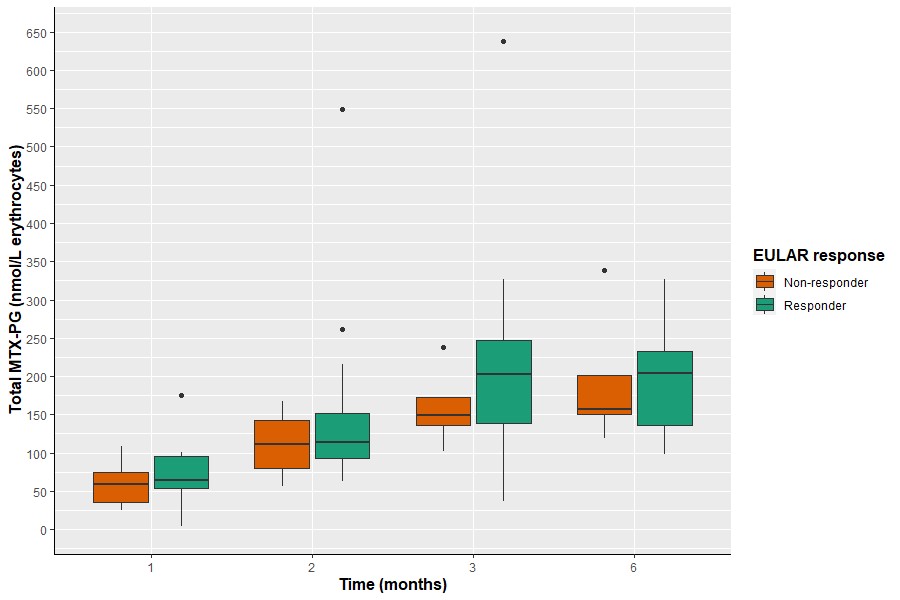 Figure 3. MTX-PG total in RBCs versus response with responders tending to have higher MTX-PG total levels compared with non-responders.