
Poster Session B
Systemic lupus erythematosus (SLE)
Ruth Fernandez Ruiz, MD, MSc
Hospital for Special Surgery / Weill Cornell Medicine
New York, NY, United States
.jpg) FIGURE 1. R848-induced type I interferon production by B lymphoblastoid cell lines after treatment with the PKGI agonist 8-CPT-cGMP. Type I interferon production by lymphoblastoid cell lines after treatment with the TLR 7/8 agonist R848 (5 uM) +/- the PKGI agonist 8-CPT-cGMP (200 uM). Each symbol represents a cell line (assessed by duplicates). *p < 0.05 by the Wilcoxon matched-pairs signed-rank test.
FIGURE 1. R848-induced type I interferon production by B lymphoblastoid cell lines after treatment with the PKGI agonist 8-CPT-cGMP. Type I interferon production by lymphoblastoid cell lines after treatment with the TLR 7/8 agonist R848 (5 uM) +/- the PKGI agonist 8-CPT-cGMP (200 uM). Each symbol represents a cell line (assessed by duplicates). *p < 0.05 by the Wilcoxon matched-pairs signed-rank test..jpg) FIGURE 2. R848-induced type I interferon production after treatment with the PKGI agonist 8-CPT-cGMP (2A) and the non-selective ROCK inhibitor Y27632 (2B). Type I interferon production by peripheral blood mononuclear cells from healthy controls at baseline and after treatment with the TLR 7 agonist R848 (5 uM) +/- the PKGI agonist 8-CPT-cGMP (200 uM, n=4) or the ROCK inhibitor Y27632 (60 uM, n=5). Each symbol represents a cell line (assessed by duplicates). Statistical differences were determined by the Wilcoxon matched-pairs signed-rank test (P=0.125 for R848 vs. R848+PKGIa and P=0.188 for R848 vs. R848+ROCKi). NS = Not statistically significant.
FIGURE 2. R848-induced type I interferon production after treatment with the PKGI agonist 8-CPT-cGMP (2A) and the non-selective ROCK inhibitor Y27632 (2B). Type I interferon production by peripheral blood mononuclear cells from healthy controls at baseline and after treatment with the TLR 7 agonist R848 (5 uM) +/- the PKGI agonist 8-CPT-cGMP (200 uM, n=4) or the ROCK inhibitor Y27632 (60 uM, n=5). Each symbol represents a cell line (assessed by duplicates). Statistical differences were determined by the Wilcoxon matched-pairs signed-rank test (P=0.125 for R848 vs. R848+PKGIa and P=0.188 for R848 vs. R848+ROCKi). NS = Not statistically significant.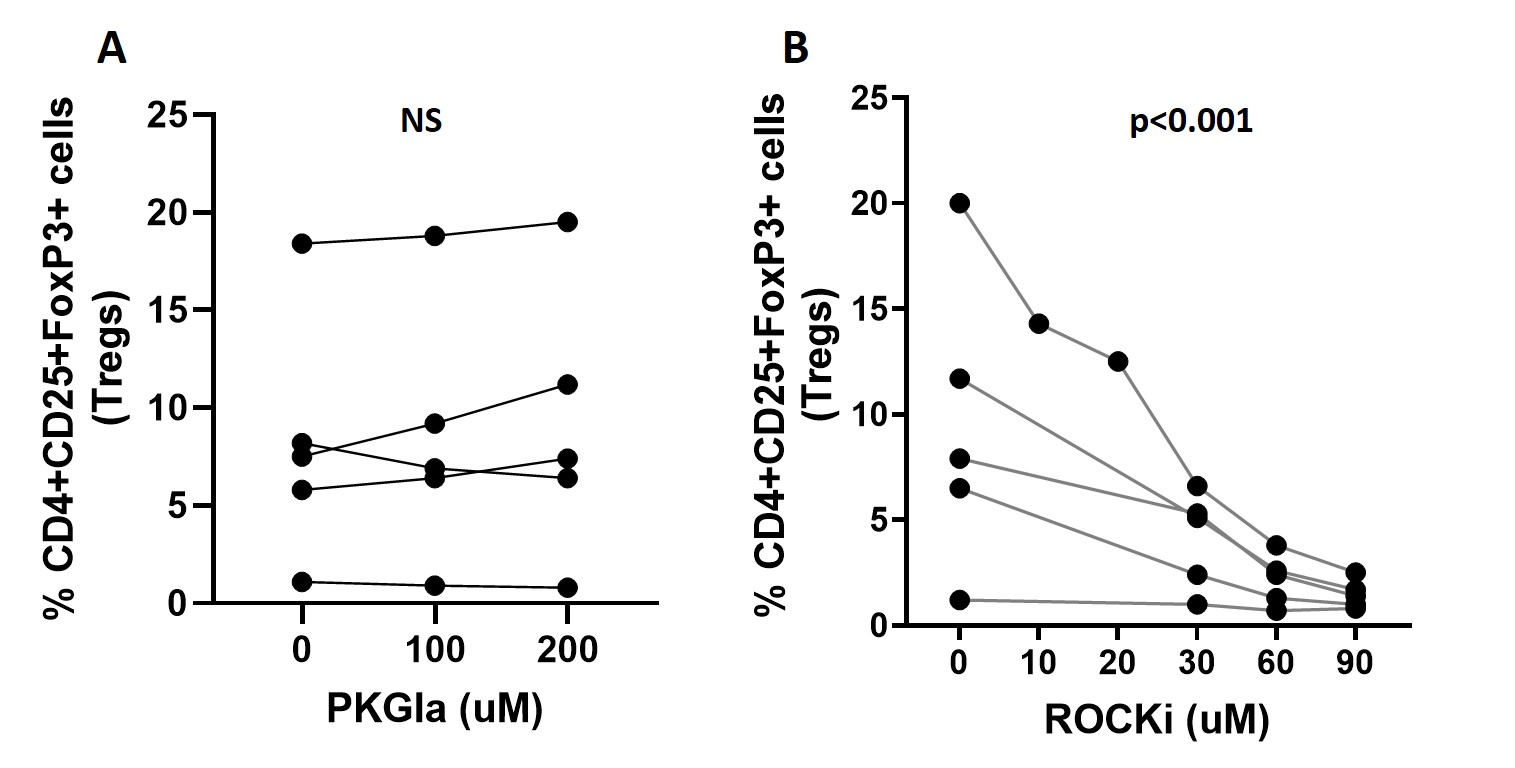 FIGURE 3. Treg percentages with and without treatment with the PKGI agonist 8-CPT-cGMP and the non-selective ROCK inhibitor Y27632. Percentages of Treg (CD4+CD25+FoxP3+) cells with and without treatment with increasing doses of the PKGI agonist 8-CPT-cGMP (0-200 uM) or the non-selective ROCK inhibitor Y27632 (0-60 uM). Each symbol represents PBMCs from a healthy control (n=5). Statistical differences were determined by the sum-of-squares F test. NS = Not statistically significant.